Venture Capital Disrupts Itself: Breaking the Concentration Curse
The Old Wives Tale … Conventional investor wisdom holds that a concentrated number of certain venture firms invest in a concentrated number of companies that then account for a majority of venture capital value creation in any given year. Therefore, LPs seeking compelling venture capital returns should only commit to a handful of franchise managers. And those are precisely the managers that do not offer access. Thus, LPs are “cursed” and will never experience the differentiated return pattern offered by venture capital exposure.
… Is Flawed. As the venture capital industry and technology markets have evolved and matured, however, more managers are creating significant investment value for LPs, with value increasingly created through companies located outside the United States and across a range of subsectors. Specifically, our analysis of the top 100 venture investments as measured by value creation (i.e., total gains) per year from 1995 through 2012, an 18-year period, demonstrated:
- an average of 83 companies each year account for value creation in the top 100 investments in the asset class for each year;
- in the post-1999 (i.e., post-bubble) period, the majority of the value creation in the top 100 each year has, on average, been generated by deals outside the top 10 deals;
- an average of 61 firms account for value creation in the top 100 investments in venture capital per year; and
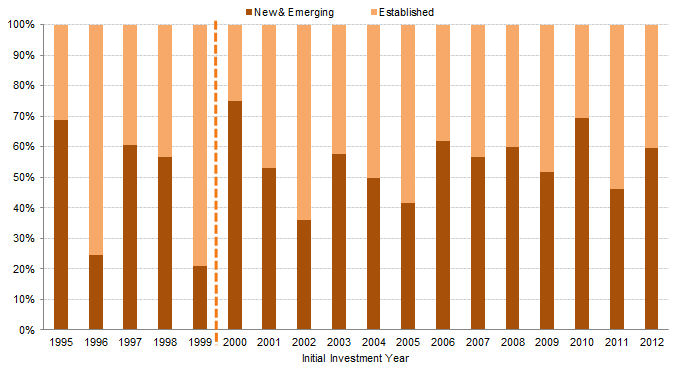
- the composition of the firms participating in this level of value creation has changed, with new and emerging firms consistently accounting for 40%–70% of the value creation in the top 100 over the past 10 years.
In short, the widely held belief that 90% of venture industry performance is generated by just the top 10 firms (which our analysis shows was somewhat relevant pre-2000) is a catchy but unsupported claim that may lead investors to miss attractive opportunities with managers that can provide exposure to substantial value creation.
Broad-Based Value Creation
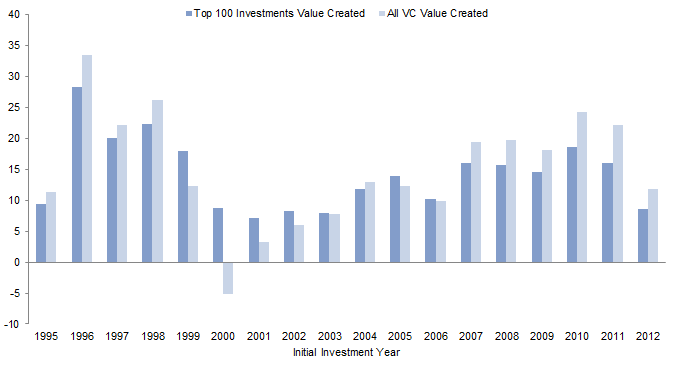
For the 18 years covered by this analysis, the top 100 investments accounted for a percentage of total value creation that ranged from a minimum of 72% in 2012 to a maximum of over 100% across several years, making this a robust data set to analyze (our methodology is described in the sidebar). The top 100 deals’ total gains outstripped the total gains of the asset class in each of the years that marked the dotcom crash (1999 to 2003) and in 2005 and 2006 (Figure 1). This fact was particularly salient in 2000, when the asset class as a whole generated a net loss, while the top 100 showed a gain, as well as in 2001, when the total gains of the top 100 accounted for 217% of the asset class’s gains.
Figure 1. Venture Capital Value Creation: Top 100 Investments Compared to Total Asset Class
As of December 31, 2014 • US Dollar (billions)
Source: Cambridge Associates LLC.
Notes: Value created represents total gains (total value minus total investment costs). All VC Value Created is inclusive of the top 100 investments.
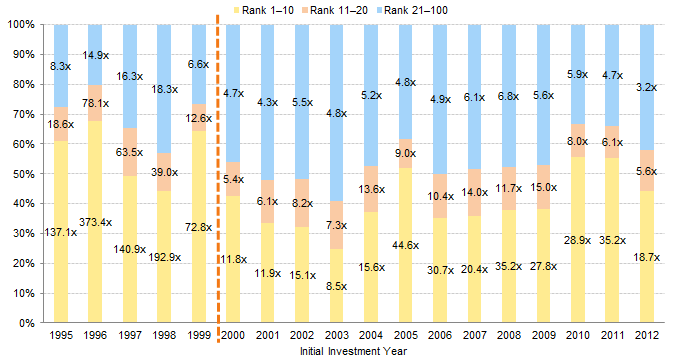
Yet, make no mistake: there is substantial, broad-based value creation in venture capital. Post-1999, investments ranked 11 through 100 accounted for an average of 60% of the total gains generated by the top 100 investments per investment year (Figure 2), besting the top 10. The exceptions to this trend were 2005 and 2010, which were driven by investments in two outstanding companies, and 2011, which is still developing from an investment maturity standpoint. This is in contrast to the pre-2000 period, in which the top 10 investments accounted for an average of 57% of the total gains, ranging from 44% to 68%. Indeed, after 1999, the pooled gross MOIC generated by the cohorts appears to have stepped down from the lofty highs of the comparable tech bubble cohorts.
Figure 2. Total Gains in the Top 100 Investments: Percentage of Total Gains Generated by Total Gain Rank
As of December 31, 2014
Source: Cambridge Associates LLC.
Notes: In each year, investments were ranked 1 to 100 by total gains and then grouped by top ten, 11 to 20, and 21 to 100. Labels on bars are the pooled gross MOIC for the investments in each ranking range. In 1995, for example, investments in the top ten accounted for over 60% of the total gains generated by the top 100 investments and generated a pooled gross MOIC of 137.1x.
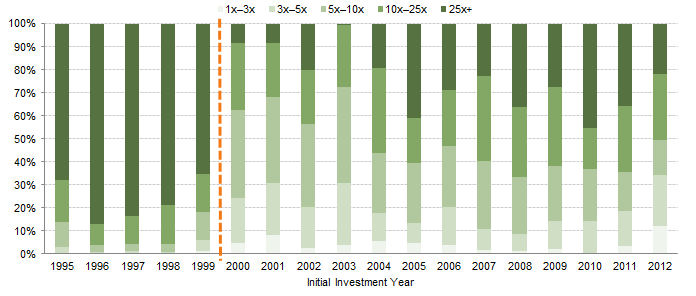
Minding the Multiples. While much is being said about unicorns, defined as venture-backed companies that achieve a $1 billion valuation, investors should stay in vigilant pursuit of those managers making venture investments that deliver substantial total gains on the valuations they have paid. Figure 3 demonstrates that substantial value creation is very much alive and well, depicting gross MOIC dispersion of the top 100 total gains from 1x–3x all the way through to 10x–25x, and our favorite, 25x+. Analysis incorporating these ranges is likely not on offer in any other investment strategy, and underscores the opportunity for investors. Deals that generated a gross MOIC of 5.0 or greater accounted for an average of 85% of total gains in the top 100 investments per investment year, and in most years, at least 60% came from investments that generated a gross MOIC of at least 10.0. The pooled gross MOIC for investments outside the top 10 was greater than 4.6 in all mature years (i.e., excluding 2011 and 2012) included in the sample set, and the average pooled gross MOIC of deals outside the top 10 across the entire data set was 8.5. As with Figure 2, one can see the two eras of venture capital quite clearly, with an average pooled gross MOIC pre-2000 of 32.8 versus the average of 7.8 after 2000.
Figure 3. Total Gains in the Top 100 Investments: Percentage of Total Gains Generated by Gross MOIC Range
As of December 31, 2014
Source: Cambridge Associates LLC.
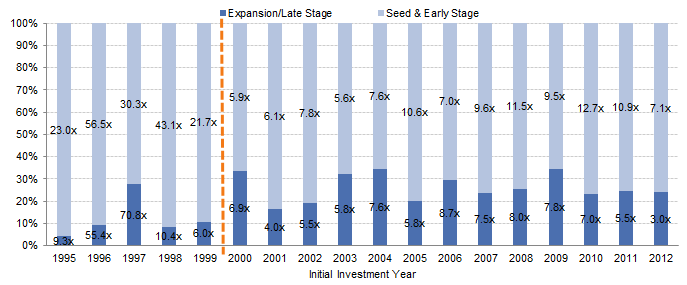
The Unusual Suspects: Not Just Silicon Valley-based, Consumer Internet Investments Driving Returns. Companies represented in the top 100 investments show increasing diversity. Although many investors have abandoned investing in health care venture capital, health care investments accounted for 10% to 30% of the total gains produced by the top 100 investments in most years. Seed- and early-stage investments have accounted for the majority of investment gains in every year since 1995 (Figure 4), suggesting that despite the deep pockets of late-stage investors, early-stage investments hold their own on an apples-to-apples basis (total gains). Within the United States, the share of the top 100 investments originating from outside of the traditional venture capital hotbeds of California, Massachusetts, and New York have consistently accounted for as least 20% of the total gains created within the United States, and, in 2004, roughly 50% of gains from US investments came from investments based outside these major hubs.
Figure 4. Total Gains in the Top 100 Investments: Percentage of Total Gains Generated by Initial Deal Stage
As of December 31, 2014
Source: Cambridge Associates LLC.
Note: Labels on bars are the pooled gross MOICs for the investments in each deal stage, which was determined by deal stage at time of investment.
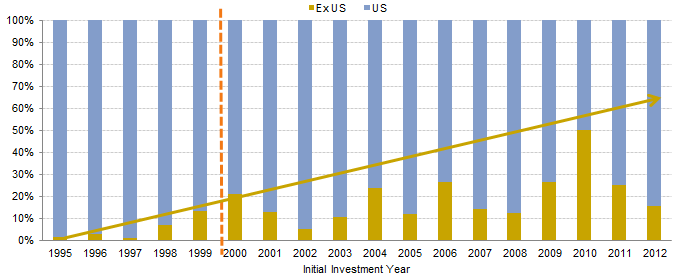
International investments have accounted for a larger share of the top 100 gains: from 2000 through 2012, they represented an average of 20% of the total gains in the top 100, compared to an average of just 5% from 1995 to 1999, and they reached as high as 50% of gains in 2010 (Figure 5). China, in particular, has emerged as a venture capital hotbed. Europe’s venture capital activity has continued to accelerate in recent years, propelled by successes in technology companies across a variety of subsectors. The tailwinds of lowered costs of company creation and increased access to cloud computing infrastructure (discussed in more detail later), coupled with changing cultural mindsets around entrepreneurship and risk-taking, suggest that international deals will account for an increasingly large share of the top 100 deals going forward.
Figure 5. Total Gains in the Top 100 Investments: Percentage of Total Gains Generated by Deal Geography
As of December 31, 2014
Source: Cambridge Associates LLC.
Note: Geography detemined based on location of investment.
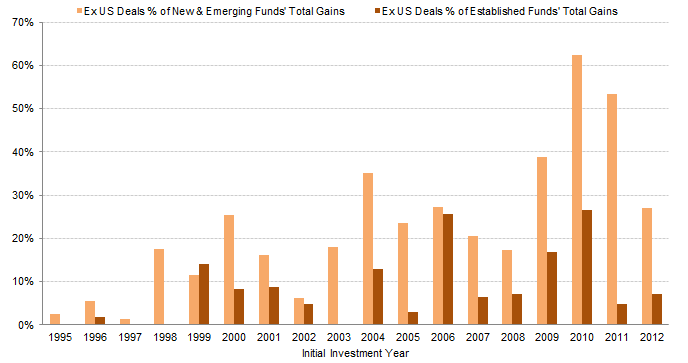
Make Room in the Winner’s Circle. The composition of venture managers participating in the top 100 investments is not static. To be sure, certain franchise Silicon Valley firms continue to invest in an impressive number of the top 100 investments, but in every year since 2000, at least 57 firms have accounted for at least one of the top 100 investments, with the profits from those investments shared more broadly across the industry than conventional wisdom would assert. Moreover, in the post-1999 period, an average of 65 firms per year made investments in the top 100, a 33% increase from the average number of firms that made top 100 investments in the bubble period (including those firms that succeeded in the bubble and subsequently underperformed and wound down). Further, for the last 10 years, 40%–70% of total gains were claimed by new and emerging managers, a clear signal to investors to maintain more constant exposure to this cohort (Figure 6). This makes sense: emerging managers have shown an increased willingness to capture the greater diversity in investments occurring in the top 100. For example, in the post-1999 period, 25% of the total gains driven by emerging managers in the top 100 have come from ex US investments, versus just 11% for established managers (Figure 7). Emerging managers are also highly likely (though not necessarily more likely than established firms in the top 100) to make their initial investments at the seed- and early-stage.
Figure 6. Total Gains in the Top 100 Investments: Percentage of Total Gains Generated by Fund Status
As of December 31, 2014
Source: Cambridge Associates LLC.
Notes: Fund status determined by stage of fund at time of investment. New & emerging funds defined as funds I–IV and established funds as V or greater.
Figure 7. Ex US Investments as a % of Total Gains Generated by Emerging and Established Firms in Top 100
As of December 31, 2014 • Percent of Fund Grouping’s Total Gains
Source: Cambridge Associates LLC.
Notes: Fund status determined by stage of fund at time of investment. New & emerging funds defined as funds I–IV and established funds as V or greater.
There are more winners, and even the elite top 10 firms per year have turnover. Although in the post-1999 period, the top 10 firms in a given year account for (on average) roughly half of the total gains generated for such year, there is little concentration in the firms that represent the top 10 over time. From 2000 through 2012, 70 firms registered at least one top 10 deal, firms with a top 10 deal accounted for an average of just 1.4% of the total number of top 10 deals across the period (i.e., 130 deals in aggregate), and no firm accounted for more than 7.7% of the top 10 deals across the period. This compares to the pre-2000 period, in which just 25 firms had at least one top 10 deal and five firms accounted for at least 8% of all the top 10 deals in the period. Therefore, it behooves investors to have adequate diversification in their venture programs.
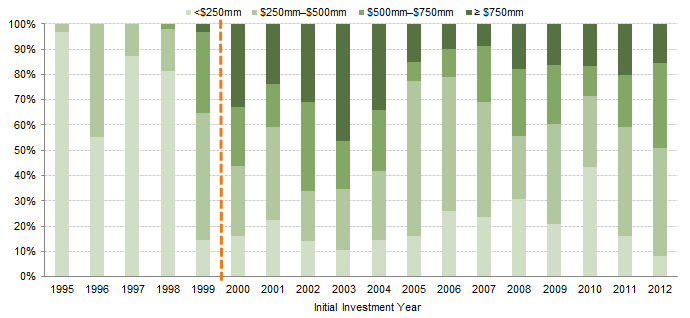
Smaller Funds Hold Their Weight. Examining the characteristics of these managers by fund size reveals that the industry has shifted from clear dominance by funds of less than $500 million in the pre-2000 era to a more dispersed distribution of fund size (Figure 8). That said, since 2005, managers with funds of less than $500 million have accounted for at least 50% of the total gains in the top 100 investments, including five years accounting for more than 60% of the total gains in the top 100. More specifically, from 2000 through 2012, funds of less than $250 million accounted for an average of 20% of total gains, and funds of $250 million to $500 million accounted for an average of 36% of total gains. A small fund does not necessarily signal an emerging fund—some more established firms have recognized the logic in raising smaller, more focused funds and are doing so.
Figure 8. Total Gains in the Top 100 Investments: Percentage of Total Gains Generated by Fund Size
As of December 31, 2014
Source: Cambridge Associates LLC.
Why Value Creation Is More Broadly Dispersed
The progression of the composition of investments in the top 100 and the firms that invest in them illustrates the need for venture firms to remain as dynamic as the markets in which they invest.
Continued technology innovation, the expansion of start-ups beyond traditional tech hubs, and the changing needs of entrepreneurs from their venture capitalists have enabled the creation of new, innovative venture firms, have forced established firms to innovate their own models, and could further de-concentrate value creation in the industry.
Technology Trends Impact Scale, Time-to-Market. A number of substantial technological trends in information technology and health care have enabled the emergence of new companies that have developed significant scale in a short period. The pace of innovation continues to accelerate, and innovative startups are increasingly addressing global markets from the moment they begin selling products. The pace of innovation is evident in information technology, as the cloud computing stack (software-as-a-service, platform-as-a-service, and infrastructure-as-a-service) continues to transform enterprise software and new pioneers disrupt large incumbents; in mobile, as the proliferation of smartphones enables the rapid emergence and success of companies with business models that depend on mobile; and in health care, where the falling costs of gene sequencing are now enabling widespread use to transform modern-day drug research, development, and, ultimately, therapies and diagnostics.
The Lean Start-Up and Its Effects. The declining costs of building technology companies have enabled technology entrepreneurship to expand beyond traditional venture capital hubs. Easily accessible, scalable, cloud-based computing capacity has obviated entrepreneurs’ need to invest substantial capital in infrastructure hardware, which has in turn led to high-quality companies being created in a wider range of geographies. In the United States, an increasing number of top 100 total gain investments have emerged from outside traditional hubs. Seattle and Los Angeles, in particular, have enjoyed success, while the Midwest has a burgeoning entrepreneurship ecosystem. Aside from Israel, other regions in Europe and Asia—sometimes aided by government incentives—continue to capitalize on their technical talent and are embracing the risk-taking culture necessary to create large technology companies. US-based venture firms willing to invest in less trafficked US regions and abroad, as well as venture firms based internationally, have captured the value created by a broadening geographical opportunity set.
Evolving Support for Portfolio Companies. The evolution in the startups that constitute the venture capital opportunity set has forced venture firms to re-examine their roles as venture capitalists, with many focused on how they can improve the ways they add value to portfolio companies. Venture firms can no longer simply compete on capital alone; entrepreneurs today have options and venture capital is not the cottage industry it once was. Given the explosive growth rates that changes in technology have enabled (as described in the preceding paragraphs), venture firms have increasingly focused on how they can help their companies scale in an sustainable, efficient manner. One model gaining some traction is giving portfolio company entrepreneurs a team of operating professionals to rely on for the functional areas of their business in which they want advice. While this harkens back to the bumper crop of incubators or firms with business development professionals in their ranks during the tech bubble, some thoughtful firms have considerably evolved this model and added other components, such as creating a community among portfolio companies that entrepreneurs can leverage, which has engendered respect and loyalty among the tech entrepreneurial community.
Venture Capital Firms Are Not Your Father’s Oldsmobile; Rather, Think Tesla. A prominent trend contributing to the success of emerging firms has been the rate at which entrepreneurs spin out of large, successful (and formerly venture-backed) technology companies. Simultaneously, emerging principals and partners at existing venture capital firms have shown an increased appetite for spinning out and starting their own firms and building platforms they see as best suited to address the market opportunity. Part of these newer firms’ success relates to their networks with younger entrepreneurs; however, these venture firms also deserve credit for pioneering a new wave of specialization of venture capital. While 10 years ago investors may have referred to a specialized firm as one focused only on technology, the emerging firms succeeding today have refined their focus to certain subsectors (such as IT infrastructure and ecommerce) or certain themes (transformational data assets). The sharper focus on subsectors enables firms to carve out niches in an increasingly competitive market.
Conclusion
The dynamism of technology and health care markets since the bubble period has broken venture’s concentration “curse.” High-quality companies are increasingly created in many corners of the world on relatively lean models. The entrepreneurs of these companies are often younger, increasingly do not come from Silicon Valley, and do not need to rely on an insular group of networks to get funded or build their companies.
Given the proliferation of these technology trends and entrepreneurs, the majority of gains in the top 100 venture investments are no longer concentrated in the top 10 investments in a given year; moreover, the strong aggregate performance of the other 90 demonstrates the value of the broader venture capital industry. In every era, new firms have emerged and succeeded with focused models, relevant experience, and fresh networks that address the opportunity set before them. Indeed, some of these firms have forced established firms to innovate their own models to stay competitive. The next era will contribute its own evolutionary traits to venture capital. Investors that selectively add exposure to managers embodying these traits should be better positioned to benefit from venture capital’s own version of creative destruction.
Venture capital’s dynamic nature and its maturation mean investors are able to build successful venture programs without “franchise funds.” However, venture capital portfolio construction remains challenging; rigorous due diligence and selectivity are critical in adding newer managers and established managers alike to a portfolio. Only institutions with truly long time horizons (10 to 15 years) and the ability to absorb an extended J-curve (negative returns) should embrace this high return asset class. This is not appropriate for investors with short-term performance objectives, or those not comfortable with spending both time and money over many years to understand the ever-changing opportunity that is venture capital.
Data Set and Methods
For the purposes of this analysis, value creation is represented by total gains, defined as the total value, realized or unrealized, of a given investment less that investment’s total cost. While there are other approaches, including total value or gross multiple on invested capital (MOIC), investments ranked by total value include large investments with little value appreciation, while investments ranked by MOIC include investments with high multiples but low absolute value creation. Total gains, in our view, measure a manager’s ability to generate profit on an investment, which is a better metric for comparing the performance of different-sized investments. We then narrowed our focus to the top 100 investments per initial investment year (with cash flow and valuation data aggregated by initial investment year), as ranked by total gains.Beginning with 1995, the first year in which the aggregate total gains in venture capital exceeded $10 billion, our analysis continues through to 2012, which, while still a relatively recent investment year, captures the value created by some noteworthy high-growth investments.In total, these 1,800 investments, representing 1,211 companies, were made by 682 funds, representing 265 global venture capital managers. As the total gain analysis focused on discrete investments done by venture managers, we examined the extent to which any top 100 investments in a given year were different managers investing in the same company; since 2000, an average of 83 unique companies have been represented in the top 100 investments in each year. The difference between 100 and 83 is due to multiple funds investing in the same company in a given year.
Theresa Sorrentino Hajer - Theresa Hajer is a Managing Director of Venture Capital Research at Cambridge Associates.


