VantagePoint: Resilience in a Time of Uncertainty
Global inflation has been higher and more persistent than most economists anticipated. Some inflationary pressures related to the pandemic have started to show signs of easing, but new pressures related to Russia’s invasion of Ukraine and lockdowns associated with China’s “zero-COVID” policy create new challenges. At the same time, central banks have declared war on inflation, raising questions about how aggressive they will be and if a recession is imminent.
In this edition of VantagePoint, we evaluate current inflationary and deflationary crosscurrents and the implications for investors. As a preview, we conclude that the current environment favors building robustness into portfolios. We cannot rule out prospects for high inflation to persist longer than anticipated, rendering high-quality sovereign bonds as insufficient portfolio diversifiers. In such an environment, exposure to commodities could be beneficial, particularly for investors whose finances are more exposed to inflation risk. We prefer strategies that perform well during periods of inflation but aren’t reliant on it for good investment outcomes. While nothing fits this bill perfectly, we see some opportunities in areas like infrastructure and real estate.
As we have long emphasized, allocating capital to help protect against macro risks, both unexpected inflation or deflation, may lead to lower returns. As such, investors must carefully consider the role of the long-term investment pool and the degree to which such protection is necessary to meet investment goals and objectives. To make such assessments, investors should use robust scenario analyses on portfolios and associated liabilities to understand implications for different inflation outcomes.
High Inflation Is Here, but How Long Will It Last?
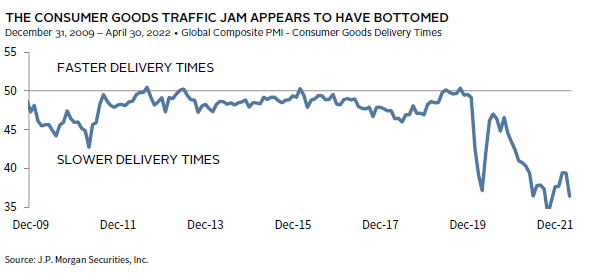
In 2021, the global economy experienced both a demand and a supply shock, which has led to excess inflation in much of the world. Demand for goods exploded during the pandemic as fiscal and monetary stimulus supported aggregate demand, while COVID-19–related constraints shifted the composition of consumer spending from services to goods. Supply could not keep up with surprisingly high demand amid low inventories, globally distributed supply chains, and tight labor markets. The outcome was higher global trading volumes, mostly originating in East Asia and flowing to the West. Amid the influx of goods, massive traffic jams built up at ports as downstream legs of the supply chain were logjammed, translating into higher consumer prices.
In the first two months of the year, these supply shocks began to fade. Fewer companies had been reporting worsening delivery times, retail inventories surged, and trucker demand fell sharply. Further, in the United States, consumer prices for “core” goods (less food and energy) fell month-over-month in March for the first time in over a year. These trends may reflect that demand for goods is abating as energy costs and consumer prices climb. Additionally, a shift toward tighter monetary policy and fading fiscal stimulus may be slowing demand.
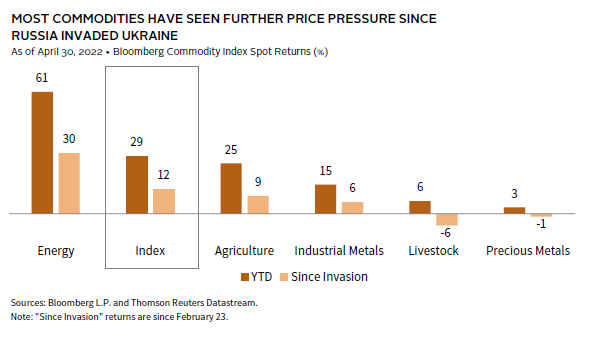
However, 2022 has seen additional supply shocks, such as Russia’s invasion of Ukraine and lockdowns in China that have complicated the inflation picture, raising the risk that elevated inflation will persist for longer. Supply disruptions related to the war in Ukraine have put upward pressure on commodities prices. Although exports from Russia and Ukraine only account for a small portion of the global economy, many countries rely on them for commodities and parts. For instance, Europe imports approximately one-third of its oil & gas from Russia, and Russia and Ukraine are key suppliers of various industrial metals, including palladium and platinum, which are needed for auto production, as well as agricultural products (e.g., grains and fertilizers).
China’s zero-COVID policy is creating further challenges, as parts of the country accounting for significant economic activity are experiencing outbreaks. Many manufacturers have suspended or curtailed operations, and in Shanghai, home of the world’s largest port, exports are reported to be down 40%. These disruptions have led to extended delivery times for goods in April, pressuring consumer prices. Meanwhile, a reduction in domestic demand has somewhat offset the upward pressure on commodities prices.
Finally, labor and housing costs are exerting inflationary pressure in affected regions. Housing prices have risen across the globe since the start of the pandemic. Residential property values are above pre-pandemic trend in 44 out of 57 countries (77%) tracked by the Bank for International Settlements (BIS). Prices are 10% and 2% above trend in advanced and emerging economies, respectively. Meanwhile, rising labor costs are particularly affecting the United States, where the gap between job openings and unemployed is historically wide. More workers may re-enter the work force and soften the pressure, as the labor force participation rate remains 1.0% below trend, in contrast with the rest of developed markets, where it has surpassed pre-pandemic levels. However, the US labor situation is unambiguously tight. While not as extreme, the United Kingdom also faces a particularly tight labor market.
In Pursuit of a Soft Landing
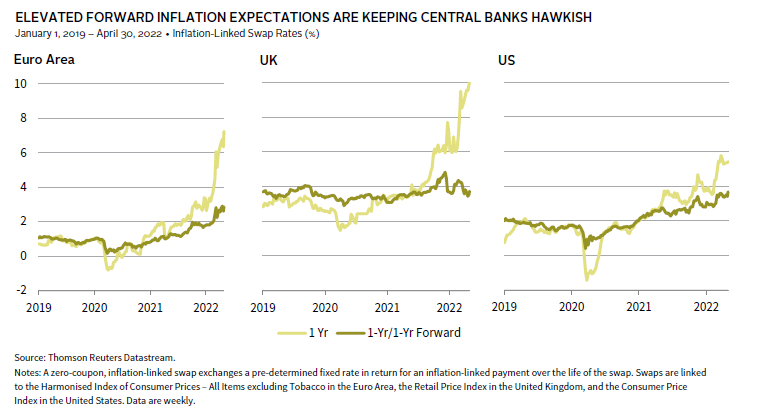
Central bankers are in a tough spot. As discussed above, a variety of underlying economic factors are at work to slow the pace of economic growth and inflation, while new inflationary pressures are feeding into the global economy. The massive disruptions caused by COVID-19, the war in Ukraine, and the transition to a low-carbon economy also complicate matters as they raise prospects that “this time is different” (a.k.a. the four most dangerous words in finance). Amid this uncertainty, we anticipate most central banks will lean more toward controlling inflation than preventing a slowdown, lest they lose credibility in a world of stubbornly higher current inflation. Indeed, swap markets are still pricing in expectations that inflation will remain high over the next 12 months. The same markets expect inflation to fall in the following year but remain above central bank targets. Longer term, bond markets are pricing in elevated five-year and ten-year forward inflation expectations relative to norms of recent decades. Further, by bringing policy rates closer to neutral and normalizing the size of balance sheets, central banks will improve their ability to hasten their pace of tightening if inflation proves more persistent than they currently anticipate.
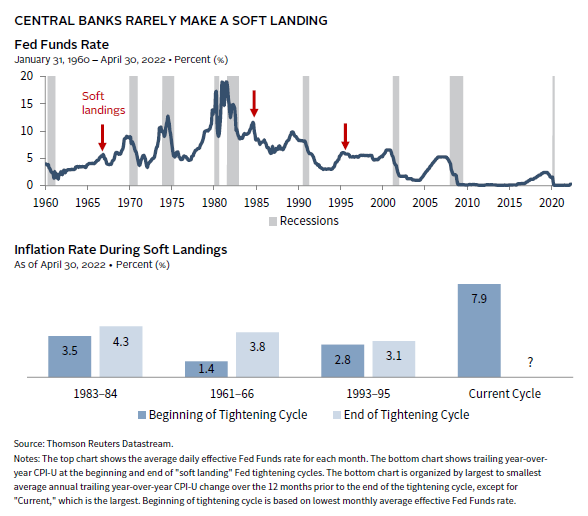
Facing such pressures, central banks around the globe are at various stages of tightening monetary policy. The US Federal Reserve has expressed that the economy and labor market are strong enough to handle their planned tightening and seeks to orchestrate a soft landing. While not impossible, this will be challenging for several reasons. First, inflation is a lagging indicator of economic conditions, tending to peak during recessions and then fall sharply with a few exceptions related to war-time inflation. Second, monetary policy tends to feed into the economy with a lag. As such, it is difficult to gauge in advance when tightening is sufficient to moderate inflation, so central banks tend to err on the side of too much tightening. Further, other factors beyond monetary policy are moving to curb inflation, such as continued easing of supply chain and transport bottlenecks, slowing consumption growth driven by rising energy costs, and slower demand from China and Europe.
Given these challenges, it is not surprising that soft landings are exceptionally rare, especially during periods of high inflation. In the United States, there have been three soft landings since 1960. All three tightening periods began when inflation was below 4%, in contrast to today’s 8.5% inflation rate. Based on their March 2022 meeting, the median Federal Open Market Committee (FOMC) member believes they can raise the Fed funds rate to 2.8% at the end of 2023 to bring inflation down to 2.7%. For context, the median tightening per Fed hike cycle since 1971 is 393 basis points (bps), well above what is currently planned based on the Fed’s March 2022 projections. As such, more tightening and/or a faster tightening pace is likely necessary. Indeed, in recent speeches, FOMC members have indicated that they are prepared to move faster, reaching their neutral policy target by the end of this year, and tightening policy rates by 50 bps several times in a row.
While central banks have the desire to normalize monetary policy and to tighten if inflation heats up beyond expectations, do they have the capacity? Can the economy withstand higher policy rates without entering a recession? There is no magic level of rates beyond which a recession will transpire, given the many different global factors that come into play. Some strategists have argued that leverage is so high that the global economy cannot withstand much of an increase in rates at all.
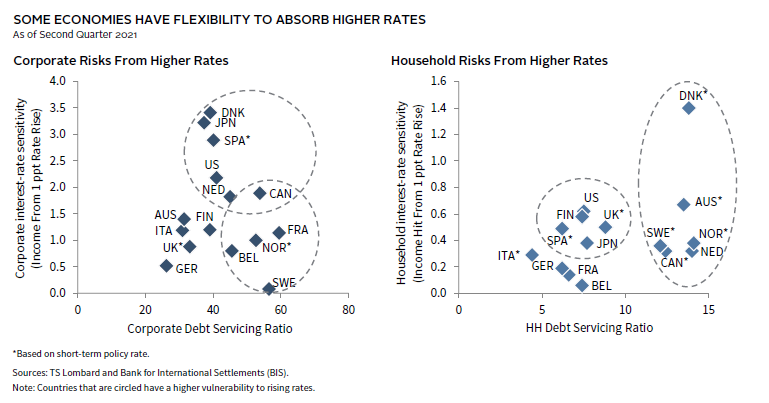
To address this question, macro research firm TS Lombard performed a helpful analysis based on BIS debt-service ratios for household and corporate sectors. Their analysis shown below considers both current debt-service ratios and their vulnerability to rising rates, which depends heavily on the degree to which borrowers’ debt is fixed or floating. Countries with higher vulnerability are circled. In most developed markets, household debt-service ratios are lower today than they were at the start of the 2008 recession, while corporate debt-service levels are more mixed. Those countries that are more vulnerable generally weathered the 2008 Global Financial Crisis relatively well and as a result accumulated more debt over the last decade. By their analysis, US interest rates could increase to 3.5% before corporate debt-service ratios reach 2008 highs, well above current rate expectations. We regard this analysis as conservative for a few reasons. First, the BIS database reports gross debt, which ignores cash on balance sheets—of which there is plenty. Second, their analysis conservatively doesn’t assume faster corporate revenue growth as rates rise.
Our baseline view is that the global economy overall can handle higher interest rates than the consensus perceives to be the case, suggesting that rates have room to increase further if inflation proves stickier than anticipated. However, if by the end of next year inflation remains well above central bank targets (e.g., 4%+) we expect central banks will seek to push rates to levels that would destroy demand and eventually lead to recession. This is a particular risk in the United States and the United Kingdom, especially if the labor market remains tight and wage increases continue to support inflation.
Potential for Long-Term Inflation Surprise
Long term, are there more factors that may support higher inflation than in the past? As we have discussed in previous publications, globalization trends that have been so central to goods deflation have largely played out and could potentially reverse. Companies across the globe are revisiting supply chain management, with some seeking to build in safeguards, such as higher inventories, multiple suppliers, and production facilities closer to end markets. Additionally, higher inflation than seen in recent decades (i.e., 3%–4%) could be welcomed by policymakers, provided it is not too much higher and not too volatile. A stable, higher-inflation environment would help reduce high debt-GDP levels.
The transition to a low-carbon economy remains a wildcard. Government spending and commodity resources required to bring about such a transition are considerable, while production capacity is constrained by limited investment in new mine capacity. Much can change as the economy decarbonizes—including technological developments that require fewer metals, better and cheaper recycling of metals, and improved mining techniques—but inflationary pressure is a risk worth monitoring.
If inflation does persist, particularly in relation to high energy and food costs, additional fiscal stimulus—in the form of subsidies and tax cuts—should be expected as governments seek to address social unrest that would likely result with unpredictable inflation and geopolitical consequences.
There continue to be potential offsets to inflation, such as increased productivity driven by government investment in infrastructure and corporate capex. Indeed, technology investment accelerated during COVID-19 lockdowns and may be a powerful force in improving productivity. Infrastructure investment has the added potential to expand capacity and ease bottlenecks, should capital be put to efficient use.
Investment Implications
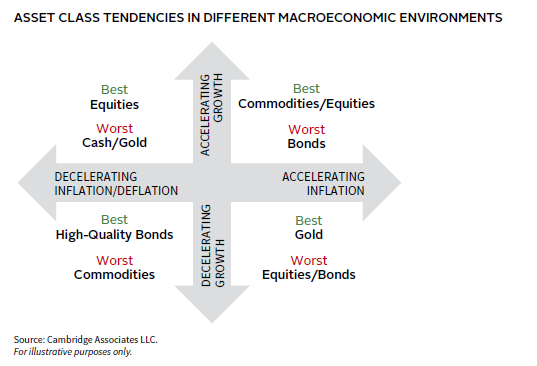
The current environment favors building resilience into portfolios. The range of possibilities for economic outcomes is varied and the nature of effective diversifiers will differ, with commodity-related assets more likely to outperform in a rising inflation environment and high-quality sovereign bonds more likely to outperform in a recessionary environment. Further, conditions are likely to vary by region and currency, as different economies are facing different pressures. Economic growth in China and Europe is slowing down, with Europe facing higher inflation pressures than China, while the United States and the United Kingdom still see strong domestic growth fundamentals, high inflation, and tight labor markets. The geopolitical situation in Ukraine and continued disruption from COVID-19, particularly in China where COVID-19 continues to disrupt supply chains, adds to the economic uncertainty. Currency diversification is also an important consideration. The US dollar is king for now, but that could change depending on relative monetary policy, growth, and inflation expectations. Given the currency volatility risk, investors should be careful about currency-related asset/liability matching, ensuring there is adequate room to fund liquidity needs over time in appropriate currencies. In sum, reviewing diversification with an eye to resilience may be helpful in the current environment.
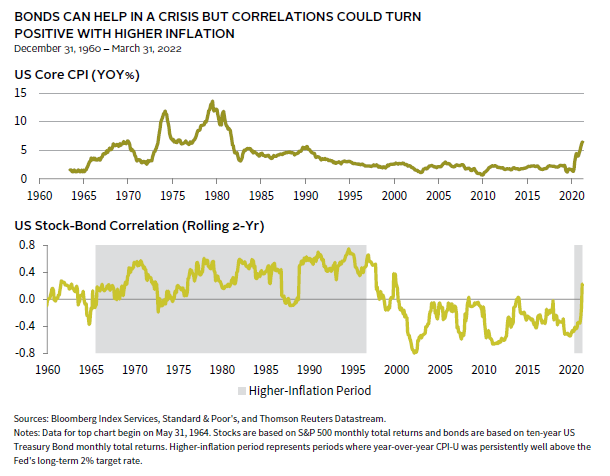
Investors must recognize that high-quality sovereign bonds in currencies facing higher inflation may not be an effective diversifier. As we have seen in 2022, both stocks and bonds have lost value as inflation expectations have escalated. High-quality bonds are still providing some flight-to-quality benefits, as seen in the immediate aftermath of the start of Russian’s invasion of Ukraine, but such benefits have faded as the market focus has shifted to inflation risk.
As previously discussed, bond yields have room to rise as major central banks have become more concerned about inflation risk than recession risk, inflation expectations are elevated, and economies may have more capacity to handle higher rates than markets anticipate. This suggests that sovereign bonds are vulnerable for now. From a long-term prospect, sovereign bonds offer more value than they have since the onset of COVID-19, as the best predictor of long-term bond returns is their yield to maturity. Still, it is hard to get excited about nominal bond yields of 2.9% in the United States, 1.9% in the United Kingdom, or 0.7% in Germany. Inflation-linked bonds offer the benefit of being indexed to consumer price inflation, but still sell at par or at a premium in most markets and offer flat to negative real yields.
Too Late for Commodities?
Investor sentiment around commodities has been terrible for the last decade and for good reason. For the decade ended 2020, the Bloomberg Commodity Index (BCOM) returned -6.5% and the MSCI World Natural Resources Index returned -2.7%, annualized. Even after blockbuster returns since the beginning of 2021 (66% and 61%, respectively), the BCOM index is still negative over the ten years ended April 30, while MSCI World Natural Resources Index returned less than 3% annualized. Despite the strong run-up last year, it is not a bad time to initiate exposure for those seeking to protect against unexpected inflation. However, investors must recognize that commodity prices can be very volatile and such investments are not for the faint of heart.
The case for commodity equities is two-fold. First, for a variety of reasons, investors have been hesitant to provide capital to commodity producers to expand productive capacity. Mining companies have been notoriously bad stewards of capital, over-expanding capacity when supply is constrained only to face a glut of supply after the long period it takes to bring new capacity online. A breaking point for many investors was the land grab to acquire reserves in the US shale boom that led to a deep bust in 2014–15. Environmental, social, and governance (ESG) concerns have also constrained capital flowing into commodity production and regulatory efforts to limit banks from lending to companies with large carbon footprints provide further limitations. The investor base for natural resources equities has demanded that such companies return capital to investors rather than invest in expanding capacity, resulting in increasing cash flows and cash distributions to investors.
The ESG case has always been complicated and today is even more so. Instead of blanket bans, we urge thoughtful implementation. Investors must consider the trade-offs they face when investing in fossil fuels, metals, and minerals. Such investments carry high-carbon footprints, although investors focused on moving to a low-carbon economy can limit investments to companies seeking to transition to a lower carbon environment or to liquid investments that can be sold over time. (Investors are accelerating commitments to bring greenhouse gas emissions to net zero by 2050. The aim is consistent with the 2015 Paris Agreement to “limit global warming to well below 2°C, preferably to 1.5°C, compared to pre-industrial levels.) Further, treatment of workers and governance can also be poor and mines are often located in geographies with significant geopolitical risk. Yet, the demand for fossil fuels will have a long tail during the transition to a low-carbon economy. Further, a variety of metals and minerals, such as copper, nickel, lithium, and rare earths are necessary inputs to electric vehicles, windmills, solar panels, and other technologies that will fuel the transition. An additional consideration today is that under-investment in fossil fuels has created more price volatility in these necessary commodities. Recent high prices have pushed up heating bills and transportation costs with the greatest impact felt by the lowest-income consumers—a form of regressive tax.
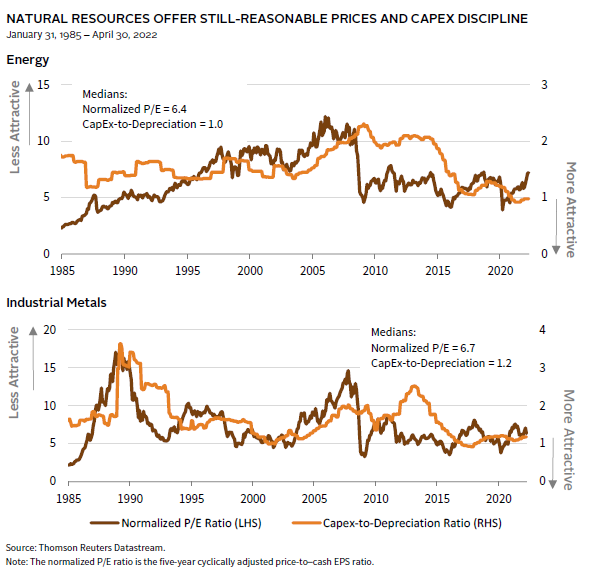
For those willing to invest in natural resources equities, recognizing the complexities of doing so is critical, including the regulatory and transition risk in a world moving to a low-carbon economy. As shown below, natural resources equities are more attractive when valuations and capital expenditures beyond maintaining capacity (proxied by the capex-to-depreciation ratio) are low. For both energy and metals, investment in new capacity has been quite low in recent years—below 1.0 for energy and about 1.2 for metals—while valuations are roughly in line with historical medians since 1985, albeit on the high side of recent history.
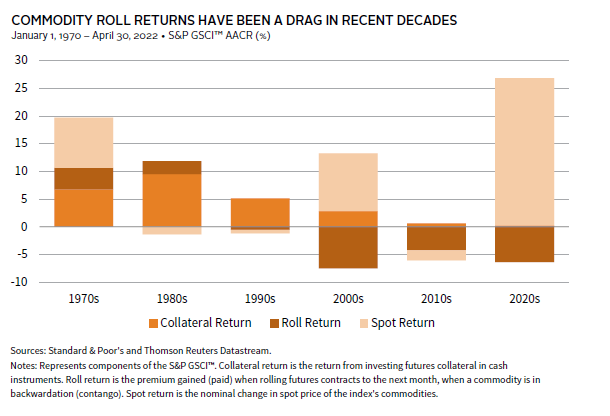
Investing in near-dated commodity futures is another means of gaining access to commodities. Like natural resources equities, the outlook for commodity futures has improved. First, in contrast to the experience of the last two decades, most commodity futures trade in backwardation, which produces positive returns as futures prices converge to higher spot prices as futures expire. Second, if central banks move as aggressively as indicated they will, cash returns on collateral will improve from the near-zero rates on offer for more than a decade. Third, commodities have more diversification potential than natural resources equities in the event of high inflation. Finally, commodity futures are less at risk from a regulatory or transition risk perspective. Provided supplies remain tight relative to demand, commodities futures should perform well. However, recession concerns amid falling demand should be expected to hurt commodity prices disproportionately relative to equities, as would technological leaps that accelerate the transition to a low-carbon economy to the degree it requires less fossil fuel or allows for metals substitution. Commodity futures tend to be more volatile than related equities, a condition that may be exacerbated by equities improved cash flow, dividend payouts and stock buybacks. In short, exposure to commodities through equities or futures is volatile even as it can be useful during periods of unexpectedly high inflation.
The Big Picture
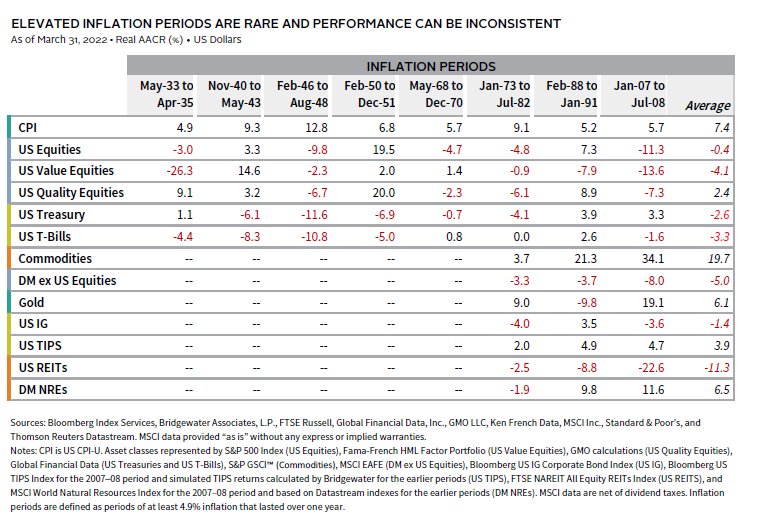
We continue to believe that predicting the future path of inflation is difficult to do well and that the best protection is a well-constructed diversified portfolio designed to meet the asset owner’s risk tolerance, portfolio objectives, and spending needs. When comparing performance of asset classes during periods of high and rising inflation, we find that protecting against short bursts of inflation is quite different than preserving real values over the longer term. During short periods of accelerating inflation, commodity futures and gold have tended to be the best performers. Unfortunately, they also lost a lot of ground when inflation was decelerating and experienced among the worst performance (absolute and risk-adjusted) over the full period from 1973–2021.
During periods that inflation surprises to the upside and is high—remains near or above 5% for at least a year—we found similar results. We evaluated asset classes for which we have data dating back to at least 1970, allowing us to assess three high-inflation periods. We also looked back further for asset classes for which we have a longer history of data. Even looking back to the 1920s, there are only eight periods that meet our criteria. As demonstrated in the table below, the ability to earn positive returns during high inflation is mixed over these eight periods. Inflation-linked bonds and commodity futures have a steady track record, but we have only three periods to consider, while the track record for all other asset classes is mixed or poor.
These results demonstrate the challenge in generalizing what works best in high inflation environments; tilting portfolios too strongly toward such an environment can be perilous, especially given how rare extended periods of inflation can be. Equities generally keep up with inflation over time, even as they have a more mixed record during inflationary periods. Should inflation increase faster than expected, pushing up the discount rate, companies that are able to increase earnings in such an environment, like cyclicals and value stocks, should perform disproportionately well. Over the long term, high-quality equities with pricing power should be best positioned to keep up with inflation even if they suffer in the short term as they adjust to rising yields.
Finally, while we don’t have a long history of data, we continue to seek out infrastructure and real estate investments for which performance should benefit from sustainable long-term trends supporting demand, like the energy transition and increased broadband demand. Real estate investments with shorter-duration lease structures (excluding volatile hotels) could also be relatively defensive in a rising inflation environment. Such investments are not without risks, including rising cap rates and cost structures in an inflationary environment; however, a carefully constructed allocation to these real assets should provide diversification with potential for some inflation protection.
Celia Dallas, Chief Investment Strategist
Joe Comras, Associate Investment Director, Investment Strategy
Bloomberg US Corporate Index
The Bloomberg US Corporate Bond Index measures the investment-grade, fixed-rate, taxable corporate bond market. It includes USD-denominated securities publicly issued by US and non-US industrial, utility, and financial issuers. The US Corporate Index is a component of the US Credit and US Aggregate Indices, and provided the necessary inclusion rules are met, US Corporate Index securities also contribute to the multi-currency Global Aggregate Index. The index was launched in July 1973, with index history backfilled to January 1, 1973.
Bloomberg US Treasury Inflation-Linked Bond Index
The Bloomberg US Treasury Inflation-Linked Bond Index (Series-L) measures the performance of the US Treasury Inflation Protected Securities (TIPS) market. Federal Reserve holdings of US TIPS are not index eligible and are excluded from the face amount outstanding of each bond in the index.
Fama – French HML Factor Portfolio
The Fama-French three-factor model is a system for evaluating stock returns developed by economists Eugene Fama and Kenneth French. High Minus Low (HML), also referred to as the value premium, is one of three factors used in the Fama-French three-factor model. HML accounts for the spread in returns between value stocks and growth stocks. This system argues that companies with high book-to-market ratios, also known as value stocks, outperform those with lower book-to-market values, known as growth stocks.
FTSE/NAREIT All Equity REITs Index
The FTSE NAREIT All REITs Index is a market capitalization–weighted index that and includes all tax-qualified real estate investment trusts (REITs) that are listed on the New York Stock Exchange, the American Stock Exchange, or the NASDAQ National Market List. The FTSE NAREIT All REITs Index is not free float–adjusted, and constituents are not required to meet minimum size and liquidity criteria.
Harmonised Index of Consumer Prices
The Harmonised Index of Consumer Prices (HICP) measures the changes over time in the prices of consumer goods and services acquired by households. It gives a comparable measure of inflation as it is calculated according to harmonised definitions. Data are available on a monthly and annual basis, broken down by detailed consumption categories.
MSCI EAFE Index
The MSCI EAFE Index is an equity index that captures large- and mid-cap representation across 21 developed markets countries around the world, excluding the United States and Canada. Developed markets countries in the MSCI EAFE Index include: Australia, Austria, Belgium, Denmark, Finland, France, Germany, Hong Kong, Ireland, Israel, Italy, Japan, the Netherlands, New Zealand, Norway, Portugal, Singapore, Spain, Sweden, Switzerland, and the United Kingdom. With 825 constituents, the index covers approximately 85% of the free float–adjusted market capitalization in each country.
MSCI World Natural Resources Index
The MSCI World Natural Resources Index is based on the MSCI ACWI, its parent index, and includes energy sector stocks plus metals & mining, paper & forest products sub-industries. The MSCI data are composed of a custom index calculated by MSCI.
S&P 500 Index
The S&P 500 Index measures the stock performance of 500 large companies listed on stock exchanges in the United States. The S&P 500 is a capitalization-weighted index and the performance of the ten largest companies in the index account for 21.8% of the performance of the index. The average annual total return of the index, including dividends, since inception in 1926 has been 9.8%; however, there were several years where the index declined more than 30%.
S&P GSCI™ Total Return Index
The S&P GSCI™ is designed as a benchmark for investment in the commodity markets and as a measure of commodity market performance over time. The S&P GSCI™ is calculated primarily on a world production-weighted basis and comprises the principal physical commodities that are the subject of active, liquid futures markets. There is no limit on the number of contracts that may be included in the S&P GSCI™; any contract that satisfies the eligibility criteria and the other conditions specified in this methodology are included. The S&P GSCI™ Total Return Index is composed of the principal physical commodities futures contracts.

