Active Equity Manager Performance Benefits as Breadth Widens
A market environment with a wider breadth of winners and losers provides greater opportunity for skilled active managers to distinguish themselves. Given the more balanced earnings contribution across sectors relative to 2020–21 and the widely dispersed equity valuations, we expect the breadth of winners and losers will be wider in 2022. This market backdrop should provide a greater opportunity for skilled active managers to distinguish themselves relative to passive benchmarks.
With the economic environment of the last couple years, it makes sense that the market coalesced around a small group of sectors whose earnings were either stable or improving, relative to a large group whose immediate future was in doubt. Moving into 2022, consensus expectations reflect a shift toward a more normal earnings contribution across sectors in the S&P 500 Index. As an example, the technology sector is a pandemic beneficiary. Its proportion of the S&P 500 Index’s total earnings went from 18.9% in 2019 to 28.6% in 2020. Since March 2020, the technology sector has contributed a third of the index’s return, which is nearly as much as the next three largest contributing sectors combined. As earnings contribution broadens, more opportunity exists for stock selection beyond a small collection of sector winners.
A wider range of valuation dispersion within sectors and across the market can provide more opportunity for skilled active managers to benefit from stock selection. Valuation dispersion relative to pre-pandemic and longer-term averages remains elevated across the S&P 500 Index and within nearly all of the index’s 11 sectors, as indicated by the spread between the 25th and 75th percentile forward price-earnings ratio. That supports a higher potential for skilled active managers to benefit from applying a more targeted approach to selecting stocks.
SKILLED ACTIVE MANAGERS CAN BENEFIT FROM A WIDE SECTOR VALUATION DISPERSION
S&P 500 Index Forward P/E Ratio Dispersion by Sector Pre-Pandemic vs Current
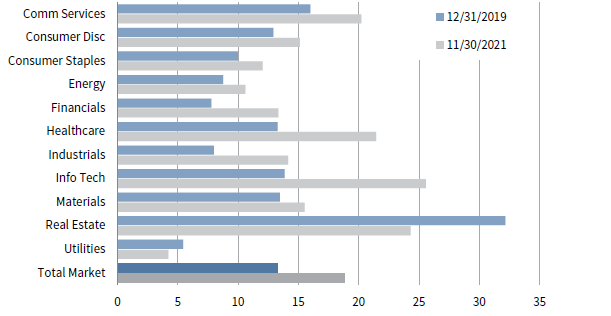
Sources: FactSet Research System and Standard & Poor’s.
Note: Chart represents difference in valuation multiples between firms at the 75th and 25th percentiles of each respective sector.
About Cambridge Associates
Cambridge Associates is a global investment firm with 50+ years of institutional investing experience. The firm aims to help pension plans, endowments & foundations, healthcare systems, and private clients achieve their investment goals and maximize their impact on the world. Cambridge Associates delivers a range of services, including outsourced CIO, non-discretionary portfolio management, staff extension and alternative asset class mandates. Contact us today.