VantagePoint: Strategic Portfolio Construction in a Changing World
The complexities of ever-changing markets present both challenges and opportunities for compounding wealth over time. Amid significant market volatility, investors should stay focused on sticking with their long-term strategy while looking for opportunities as they evolve. Shifting geopolitical alignments, the prospect of persistently high tariffs, rising sovereign debt in developed markets, and the end of zero interest rate policies (ZIRP) pose significant hurdles. Meanwhile, breakthroughs in technology—particularly in artificial intelligence (AI)—offer promising avenues for productivity gains and innovation.
In today’s dynamic environment, strategic thinking and flexibility are essential. This edition of VantagePoint revisits the core principles of best-in-class investment strategies, exploring how investors can allow wealth to compound by remaining disciplined, diversified, and focused on long-term opportunities while adapting to change. We explore the fundamentals of investment policy development, including conducting an enterprise review to understand investment goals and objectives, setting a flexible policy framework, and revising policies as needed. Additionally, we highlight best practices in portfolio construction and examine how investors can adapt their strategies to navigate today’s challenges and seize emerging opportunities.
Good Investment Policy Starts with Understanding Objectives and Constraints
Successful investors share a key trait: the discipline to adhere to a long-term strategy through both favorable and challenging times. However, there is no universal strategy that fits all. Each investor’s approach must be tailored to their unique return objectives, risk tolerance, financial constraints, investment expertise, time horizon, and resources.
The foundation of any investment plan begins with an enterprise review—a comprehensive evaluation of financial circumstances, risk attitudes, and governance considerations. This process clarifies objectives, constraints, and potential vulnerabilities, helping to mitigate surprises during crises. For institutions, this might involve assessing how asset pools support operating budgets or reliance on endowments. For families, it could mean prioritizing wealth building for future generations, current consumption, or philanthropic goals.
These priorities must also account for evolving portfolio requirements, particularly under stress. For example, institutions facing reduced government financial support may require more support from endowments, while higher interest rates may prompt pension sponsors to accelerate liability hedging as funding ratios improve.
Key considerations include operating liquidity, balance sheet flexibility, liabilities, debt structure, external liquidity access, cost structure, and income or revenue streams. Qualitative factors, such as stakeholder risk tolerance, are equally critical. Balancing short-term portfolio volatility with long-term purchasing power, addressing illiquidity constraints, and aligning with spending, debt management, and other priorities are essential to effective investment planning.
The Primacy of Policy
After completing the enterprise review, the next step is to develop an investment policy, including the formulation of a strategic asset allocation (SAA). An investment policy serves as a ten-year business plan, providing guiding principles and direction, while remaining flexible to adapt to evolving market conditions, assumptions, and execution. SAAs are not fixed anchors but dynamic frameworks that should be reviewed and refined periodically to account for long-term trends.
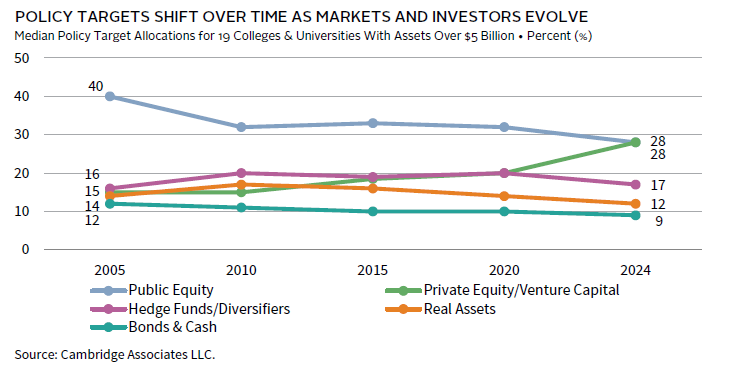
Historically, SAAs have regularly adapted to changing conditions as reflected in the median target policy allocations below. The most notable shifts have been large increases in target allocations to private equity and venture capital (PE/VC) that provide significant value-added return potential, funded primarily by reductions in public equities. By increasing these allocations, investors have been able to maintain high return expectations even as falling interest rates lowered return expectations for bonds.
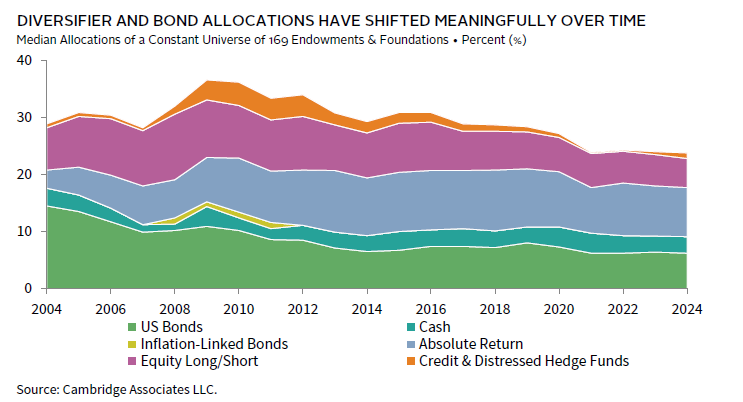
Similarly, actual allocations across endowments and foundations in our database reflect sensible shifts. For example, as bond return expectations fell, investors reduced bond allocations and reallocated hedge fund exposures toward absolute return strategies less correlated with equity risk, while trimming equity long/short strategies.
In addition to adapting to capital market circumstances, changes in investment policy often reflect evolving circumstances, such as tax considerations, significant endowment gifts, or shifts in financial strength. Flexibility in portfolio targets and allocations is critical to improving the likelihood of meeting performance objectives as conditions change.
Investment policies should align with the investor’s philosophy and governance structure. Greater latitude for portfolio implementers (e.g., investment staff, outsourced CIOs, or advisors) and longer evaluation horizons typically require less detailed asset allocation policies, allowing for more flexibility in execution.
We begin building investment policy with a foundational framework, such as a 60% equities/40% bonds or 80%/20% volatility-equivalent profile. From this base, we seek opportunities to enhance returns, while maintaining or lowering risk. Some investors may define SAA simply as a stock/bond policy, while others incorporate more detailed categories based on asset classes, objectives (e.g., growth, diversifiers, liquidity reserve), or a hybrid mix. For example, growth assets may be divided into public and private investments. This level of detail fosters alignment among stakeholders, ensuring a shared understanding of objectives, risk parameters, and strategy. Strong governance and clear expectations help keep portfolios on track and aligned with the investment committee’s intent.
Best Practice Portfolio Construction Features
Successful investment strategies begin with a well-designed policy tailored to investor needs and flexible enough to adapt to changing market conditions. Whether through adjustments to SAA, implementation decisions led by portfolio management, or through external asset managers, the following best practices guide our approach to compounding wealth over time:
- Maintain a long-term horizon to capitalize on illiquid asset classes with more potential for value-added returns.
- Use external best-in-class managers and foster lasting partnerships.
- Diversify to enhance long-term risk/return characteristics beyond a simple stock/bond portfolio.
- Adopt contrarian positions with asymmetric return potential by investing in undervalued assets and dislocated markets.
- Define and manage key risks aligned with constraints and objectives identified in the enterprise review.
Playing the Long Game
Maintaining a long-term investment horizon is one of the most challenging yet essential aspects of successful investing. Understanding the historical behavior of markets helps investors set realistic expectations for portfolios and resist the impulse to sell assets or managers based on short-term underperformance. For example, a diversified portfolio with a nominal expected return of 10% and a standard deviation of 13% would see annual returns ranging from -3% to 23% two-thirds of the time. While short-term volatility is inevitable, the range of expected returns narrows over longer horizons.
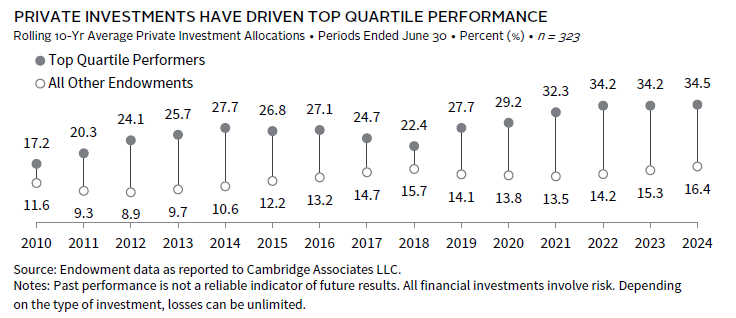
A long-term perspective enables investors to access illiquid asset classes—such as
PE/VC—which offer greater value-added return potential compared to liquid, efficient public markets. As demonstrated below, the best-performing investors over the long term have consistently maintained higher allocations to these private investments.
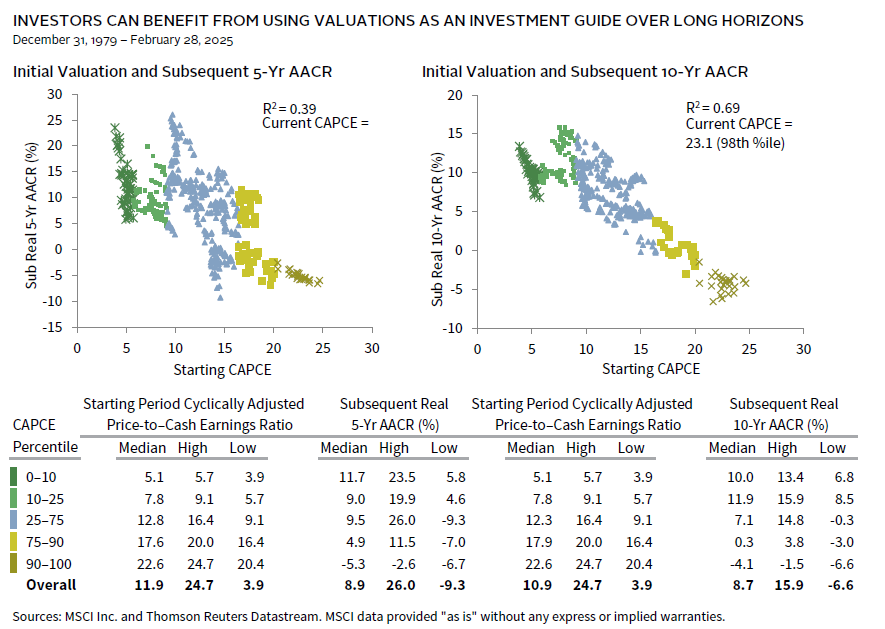
Additionally, a long horizon also allows investors to capitalize on undervalued investments. Doing so requires a strong stomach; sharp market dislocations can be quick to reverse, but absent those, valuation disparities are often slow to revert to fair value. Thus, careful judgment is required to avoid value traps. In general, absent other criteria that may serve as catalysts, a seven- to ten-year horizon is advisable. Momentum is also a powerful force and can be a helpful supplement to identify turning points.
Sourcing Best-in-Class Managers
Even the best managers experienced a difficult period relative to passive benchmarks, especially in the large-cap US equity market, given the concentration of performance in the Magnificent Seven heavyweights in recent years. Greater dispersion of returns across stocks globally should increase the ability of skilled managers to outperform. We believe active management can outperform passive benchmarks, particularly in less efficient markets, if investors: 1) employ a rigorous manager research process, 2) exercise patience, and 3) build well-diversified portfolios to reduce unintended risks. Building outperforming portfolios using active managers is hard work but worth the effort.
Engaging in deep research to identify firms with a repeatable competitive edge and strong organization that can stand the test of time is far more relevant than analyzing short-term performance. As the technology and regulatory environments have leveled the playing field for accessing corporate information, managers must work harder to gain an edge. Technology acumen can provide an advantage, but managers must continually invest to maintain their lead. Experience and judgment also go a long way to set managers apart. From an organizational perspective, we advise partnering with firms that have good governance, thoughtful alignment, a strong culture, and a well-diversified customer base of a high caliber. Securing fee structures that enable investors to retain most of the value-added returns also increases the odds of earning excess returns over the long term.
Patience in active management is key, as even the best managers experience periods of underperformance. Behavioral mistakes, such as firing managers after short-term losses, can erode returns. Staying the course through cycles is essential for long-term success.
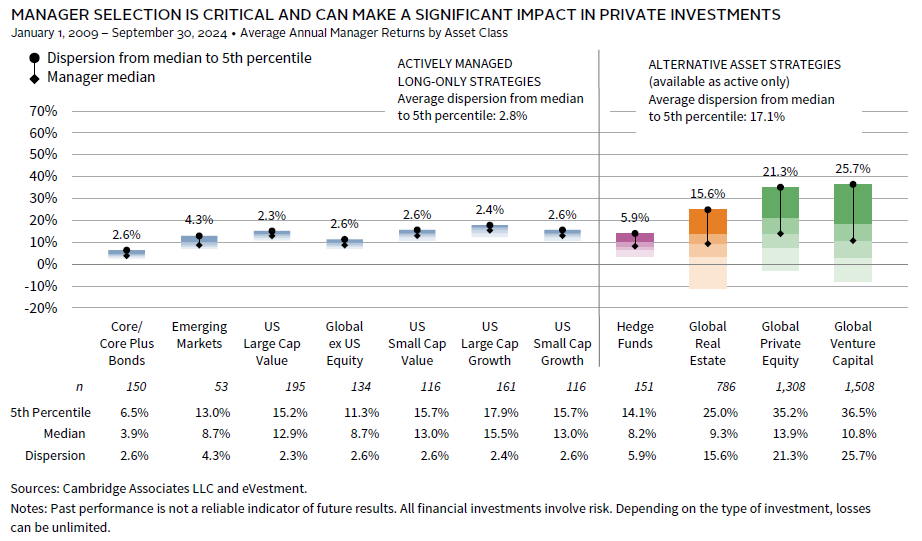
Dispersion of long-term returns varies by asset class, with more inefficient asset classes exhibiting greater dispersion across managers. The following exhibit shows the importance of manager selection, especially for private investments where manager return spreads are materially wider than for liquid, more efficient asset classes. 1
Sticking with Diversification
No one can argue with the fact that putting 100% of risk capital in US equities over the 15 years ended 2024 would have been a brilliant strategy. The MSCI US Index returned 13.9%, outperforming the MSCI All Country World Index by 4.1 percentage points (ppts) per year, in US dollar terms. However, such concentrated positioning is risky and subject to sharp reversals amid any change of fortune. Indeed, year-to-date through April 8, lofty valuations combined with prospects for implementation of the highest effective US tariff rates in more than 100 years have seen US equities underperform global ex US equities by roughly 12 ppts, in US dollar terms.
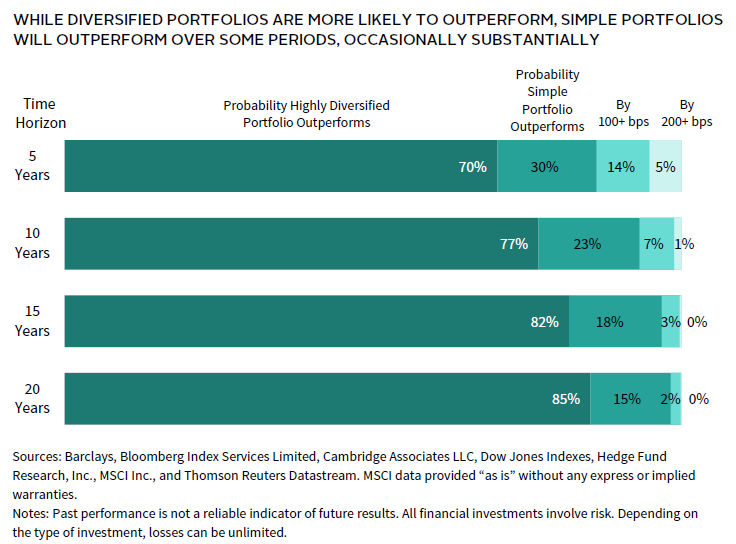
Diversification is a long-term strategy. While a simple portfolio may outperform periodically, a diversified portfolio is expected to generate higher returns over time at a given level of risk—the proverbial free lunch. To better understand the value-added potential of diversified portfolios, we compare the return profile of a simple portfolio of 70% global equities and 30% US government bonds to a highly diversified portfolio constructed to have roughly the same level of volatility as the 70%/30% portfolio. The highly diversified portfolio is expected to outperform the simple portfolio by 100 basis points (bps) over the long term, but could underperform by as much as 100 bps to 200 bps per year over shorter periods. Based on a conservative estimate using indexes to represent asset class returns, over periods of five years or longer ended in 2024, a representative diversified portfolio has outperformed the simple portfolio despite underperforming over the last three years.
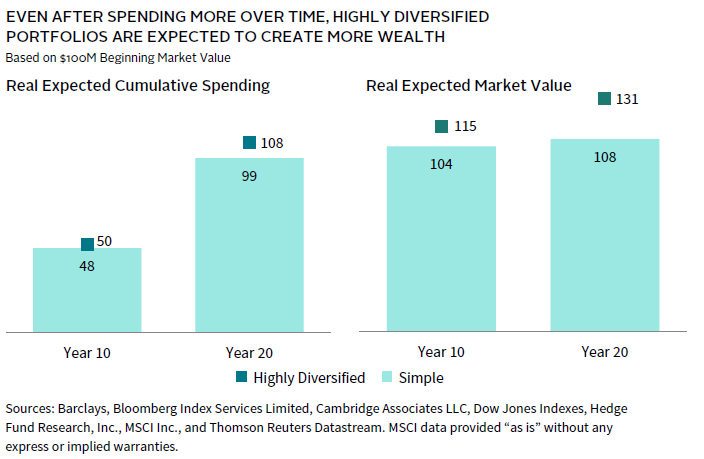
The higher expected return for the diversified portfolio reflects the ability to earn incremental returns from various sources, including private investments and pursuit of more diverse market risks. Even after spending more over time, 2 highly diversified portfolios are expected to create more wealth through the benefits of compounding. This effect is particularly pronounced over longer horizons.
Tilting Tactical
Another lever that can be used to build returns is tactical asset allocation. This typically involves shorter-term horizon positions that require in-depth analysis, a disciplined process, and risk controls. To develop an investment thesis and exit strategy, it’s important to carefully analyze the historical relationship between the overweight and underweight positions and the environments in which the positioning tends to outperform. Positioning should be sized thoughtfully, scaled by the degree of risk inherent in the position. Ideal positions have higher upside than downside, which is usually derived by relatively attractive pricing for the overweight position. Market dislocations often provide opportune times for initiating tactical positions, so studying asset class relationships and being prepared to take opportunities when they arise is beneficial.
Measuring and Managing Risks
The fundamental purpose of risk management is to provide a clear path for risk assets to compound and build wealth over time. Understanding the portfolio requirements to meet associated spending and liabilities is critical to successful portfolio management. Effective portfolio construction requires identifying and managing risks—such as illiquidity, equity beta, total portfolio standard deviation, drawdown risk, and pension funding shortfall risk—directly, rather than relying on heuristics. For instance, not all public equity portfolios are equally liquid, with emerging markets small-cap and frontier markets equities among the least liquid and US large caps, among the most liquid. Key risks should be identified during the enterprise review and incorporated into investment policy. Management of these risks should focus on taking the right amount, not just limiting risk. Failure to take enough risk could result in underperformance.
Stress testing portfolios to evaluate their resilience under a range of challenging scenarios is a critical component of policy setting and ongoing risk management. The ability to navigate bear markets depends on several factors, including portfolio liquidity, diversification, liquidity needs during periods of stress, and access to external liquidity sources. Such assessments should be repeated regularly over time as conditions change. For example, investors have increased their equity exposure and portfolio illiquidity over the last decade. Understanding how these changes relate to any changes in liquidity requirements especially during times of stress is a core component of portfolio management.
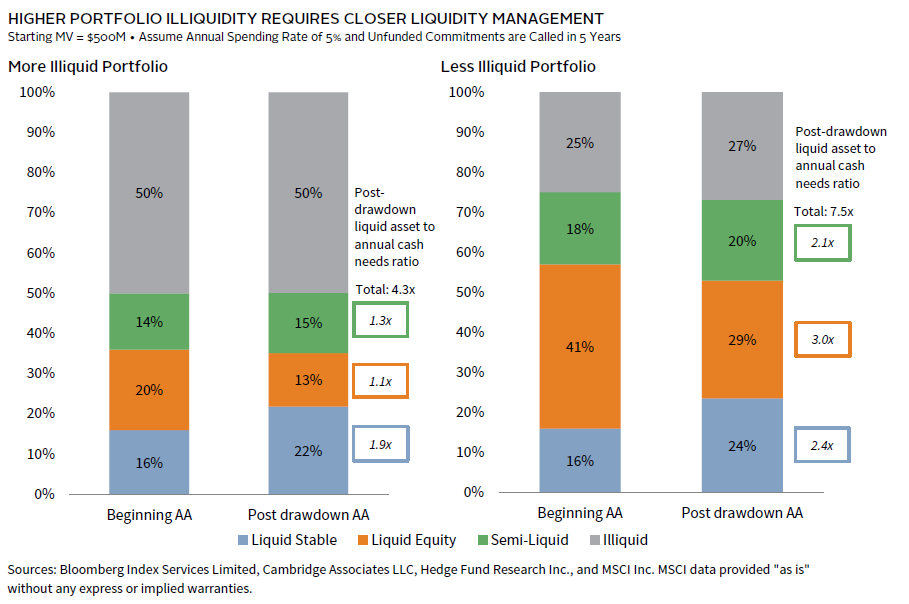
For instance, as demonstrated below using a stylized portfolio reflecting index returns, a $500 million long-term investment pool entering a 2008-like bear market would have meaningfully less portfolio liquidity available to meet cash needs if it had a 50% allocation to illiquid assets compared to a 25% allocation, despite outperforming by about 5 ppts during the drawdown. A high allocation to illiquid assets may be desirable, particularly if the institution can construct a high-performing private investment portfolio. Sustaining such a high allocation requires careful attention to liquidity sources and uses.
The example below shows asset allocation changes before any assets are sold to support cash needs. The ratio of liquid assets including stocks and high-quality bonds to annual cash needs would be 3x, compared to 5x for the less illiquid portfolio. The relatively high allocation to high-quality bonds would have provided a lifeline for the more illiquid portfolio, covering nearly two years of cash needs. Higher cash needs would constrain the ability to maintain a high allocation to illiquid assets, while lower cash needs facilitate such positioning. As a general guideline, bear markets tend not to last longer than three years without recovery, so 3x coverage of cash uses with cash sources (inside and outside the portfolio) following a bear market decline is a reasonable target. Under conditions of limited liquidity, the ability to capitalize on market dislocations would largely depend on existing managers, a factor that should be carefully considered during portfolio construction.
Risk management also extends to implementation. Using external managers to add value requires understanding how individual managers interact and align with benchmarks. Unintended risks—such as geographic, currency, economic sectors, and factor exposures (e.g., value, momentum)—can undermine returns if not carefully managed.
Adapting to Change
Portfolios have historically evolved in response to long-term trends, such as US equity and dollar outperformance since 2010, falling interest rates since 1982, and declining geopolitical risk since the 1990s. These shifts have led to increased allocations to large-cap US equities, greater US dollar exposure, reduced fixed income, and fewer hedge funds. As we move through 2025, diversification is showing signs of renewed value, and investors must assess how their portfolios would fare in the event of a reversal of these trends. We review changing economic and market conditions on an ongoing basis, regularly sharing our views on investment implications. All of these long-term trends have potential to shift the investment landscape in unforeseen ways as they evolve and interact with each other. Indeed, the evolution of global trade conditions will influence fiscal and monetary policy, the ability of countries to finance their debt, and the cost and access to materials and technology to fuel AI developments. We focus here on key implications of the end of ZIRP, challenges and opportunities in private investments, and the role of AI. Other increasingly significant factors that can influence markets and investment outcomes include shifting global trade dynamics, geopolitical risks, and climate change. Investors should remain diversified and vigilant, and incorporate these considerations into their strategic planning.
The end of ZIRP has significant portfolio implications. Higher rates suggest improved fixed income returns, but investors must carefully evaluate credit risk. Weaker credits that borrowed short term with an expectation that rates would remain low indefinitely may find their balance sheets stressed. Indeed, the market sell-off has started to pressure credit spreads in some segments of the market. We would seek to take advantage of such opportunities once spreads reach more distressed levels, including through credit opportunity funds or distressed managers that have requisite experience through investing over prior distressed cycles. Strategies like asset backed lending and insurance-linked securities can help diversify away from corporate credit risk and offer attractive spreads.
We regard high-quality sovereign bonds, particularly US Treasury bonds, as the primary part of a deflation hedge or liquidity reserve allocation. However, we acknowledge that such bonds could come under pressure due to rising interest expenses and fiscal imbalances absent successful efforts to improve debt dynamics. Treasuries served their role well this year until this week, providing much needed ballast to portfolios. However, this week saw significant Treasury volatility for technical reasons, amid an unwinding of leveraged positions. The US dollar has been reasonably stable after initially softening this year. However, US dollar weakness may resume for several reasons including concerns over US growth prospects and the tarnishing of the US exceptionalism consensus that has poured capital into US capital markets over recent years. With prospects for more fiscal and monetary stimulus in the EU and China and heightened policy uncertainty in the US, diversified global equity allocations are more compelling. US Treasury bonds remain a core defensive asset, yet diversifying with other defensive assets like inflation-linked bonds and trend-following strategies can provide similar returns with stronger downside protection.
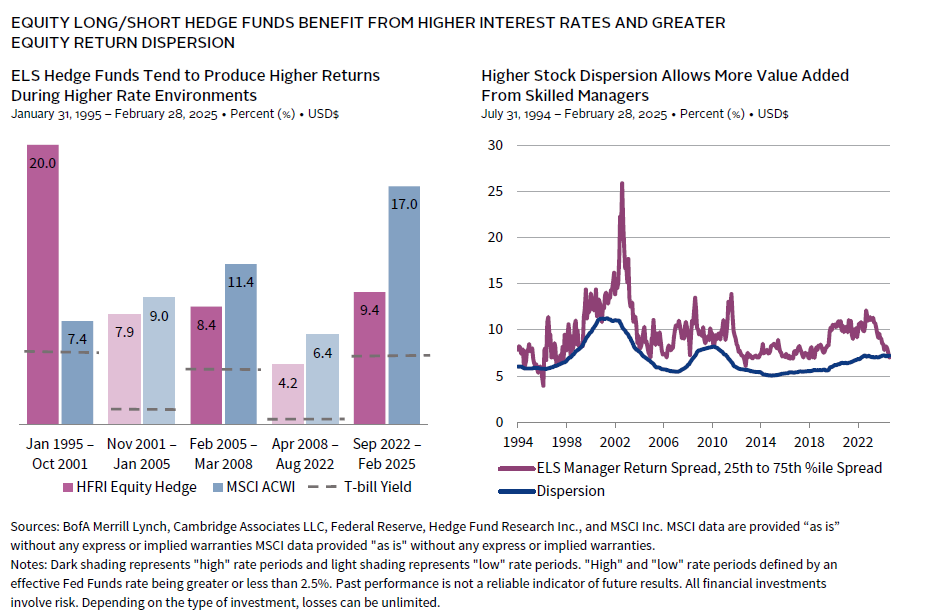
Higher rates also enhance the appeal of hedge funds. In the early 2010s, endowments and foundations allocated nearly 25% of portfolios to hedge funds, a figure which has since dropped to 16%–17%. Equity long/short hedge funds (ELS) saw the largest decline, but we anticipate a brighter future for these strategies. Higher rates improve returns on collateral, short rebates, and equity dispersion, creating opportunities for skilled stock selection. Disruptive trends—such as shifting global trade relationships, advancements in AI, and the energy transition—are likely to sustain this dispersion, benefiting active managers with strong shorting capabilities. While the HFR Equity Hedge Index still underperformed long-only global equities in higher rate periods, equity dispersion provides the opportunity for strong manager selection to close the gap. Indeed, what matters is achieving equity-like returns over the investment cycle, not matching equity returns in any one period.
And of course, higher rates pose challenges for leveraged strategies like buyouts, requiring general partners to focus on improving operating margins and revenue growth to offset higher capital costs. While valuations remain elevated, they have moderated from ZIRP-era highs.
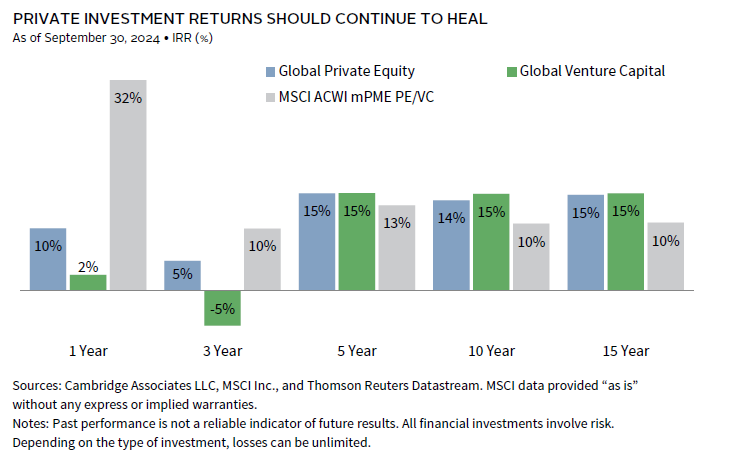
More broadly, we expect private investment performance to improve as the impact from funds’ rapid deployment of capital into overvalued assets in 2021–22 recedes. Current conditions will likely see some improvement in relative performance as market corrections have a lagged and muted impact on private investments relative to public markets. Yet, the widely expected improvement in IPO and merger & acquisition prospects may need to wait as the current environment is not conducive to improvement in the exit environment. These conditions are ripe for bringing attractive buying opportunities in the secondary market.
Disciplined investors should not be deterred by the recent underperformance of PE/VC relative to public markets. Private markets continue to offer compelling opportunities, particularly for managers with strong operational expertise. The advantages of operating outside the public market’s quarterly reporting pressures remain intact. However, investors should be mindful of the growing retail interest in private investments, which could lead to crowding at the larger end of the market. Further, investors must be exceptionally discriminating if considering investing in supersized funds, given the significant revenue to these managers through management fees relative to carry and the greater difficulty in delivering top quartile returns with very high assets under management. In private investments, effective implementation is critical to generating value-added returns that justify the illiquid, long-term exposures and the significant resources required for success.
Technological advances in AI have potential to create significant value across all sectors over time. To date, much of AI’s impact has been concentrated in public companies—namely chipmakers (e.g., Nvidia, Taiwan Semiconductor) and hyperscalers (e.g., Amazon, Alphabet)—and venture capital. Over time, opportunities will expand as AI integrates into broader industries. Private equity strategies can leverage AI to unlock value in low-margin businesses, while public companies across sectors—such as security, data analytics, and software—will increasingly adopt AI tools. Hype around generative AI’s capabilities has lifted valuations in the near term, but longer term, the transformative potential of AI underscores the importance of staying attuned to technological developments.
Conclusion
In the face of uncertainty, the investment planning process should embrace humility and avoid the pitfalls of overconfidence. For high total return–oriented investors, our approach combines the stability of a predominant allocation to equities and equity-like investments with a diversified and flexible approach. While the aggregate allocation to these growth-oriented assets should remain relatively constant, their composition should be diversified and adaptable, evolving in response to attractively valued opportunities and focusing on identifying best-in-class managers. Without adequate diversification, portfolios risk becoming overly concentrated and excessively volatile. Similarly, diversifying assets should encompass a range of strategies, with allocations shifting toward the most compelling opportunities as they arise.
For taxable investors, the cost of adjusting asset allocations can be significant, shaped by factors such as trust structures, tax status, and the availability of losses to offset realized gains. As a result, any shifts in asset allocation should be carefully evaluated, ensuring that the expected benefits outweigh the associated costs.
In a world defined by shifting economic regimes, technological disruption, and evolving market dynamics, investors must embrace a strategic, flexible, and forward-looking approach to portfolio construction. By adhering to core principles—such as maintaining discipline, embracing diversification, and managing risks thoughtfully—investors can navigate uncertainty and capitalize on emerging opportunities. Adapting to change is not just a necessity but a competitive advantage, enabling investors to build resilient portfolios that align with their long-term objectives. As the investment landscape continues to evolve, those who remain vigilant, innovative, and committed to their strategy will be best positioned to succeed.
Celia Dallas, Chief Investment Strategist
Grayson Kirk and Graham Landrith also contributed to this publication.
The absolute return hedge fund category includes strategies such as arbitrage, global macro, market neutral, multi-strategy, and open mandate hedge funds that fall outside of the equity long/short, credit, and distressed classifications.
The number of institutions included in the rolling ten-year average calculations varies by period, ranging from 202 in 2000 to 323 in 2024. Each institution’s private investment allocation represents the mean across the respective ten-year period. For example, the 2024 data represent the average across the 11 June 30 periods from 2014 to 2024.
Data are monthly. The last full five-year period was March 1, 2020, to February 28, 2025, and the last full ten-year period was March 1, 2015, to February 28, 2025.
Returns for bond, equity, and hedge fund managers are average annual compound returns (AACRs) for the 15 years ended September 30, 2024, and only managers with performance available for the entire period are included. Returns for private investment managers are horizon internal rates of return (IRRs) calculated since inception to September 30, 2024. Time-weighted returns (AACRs) and money-weighted returns (IRRs) are not directly comparable. Cambridge Associates LLC’s (CA) bond, equity, and hedge fund manager universe statistics are derived from CA’s proprietary Investment Manager Database. Managers that do not report in US dollars, exclude cash reserves from reported total returns, or have less than $50 million in product assets are excluded. Performance of bond and public equity managers is generally reported gross of investment management fees. Hedge fund managers generally report performance net of investment management fees and performance fees. CA derives its private benchmarks from the financial information contained in its proprietary database of private investment funds. The pooled returns represent the net end-to-end rates of return calculated on the aggregate of all cash flows and market values as reported to Cambridge Associates by the funds’ general partners in their quarterly and annual audited financial reports. These returns are net of management fees, expenses, and performance fees that take the form of a carried interest. Vintage years include 2009–21.
The “Liquid Stable” category includes Treasuries and investment-grade credit, the “Liquid equity” category includes global public equities, the “Semi Liquid” category includes hedge funds, and the “Illiquid” category includes private investments. The “More Illiquid Portfolio” assumes a 25% higher private investment allocation vs. the “Less Illiquid Portfolio”, funded from global equity (21% higher) and equity hedge funds (4% higher). The Global Financial Crisis is used to reflect returns during a drawdown period and asset classes are represented by the following: public equities (MSCI All Country World Index), absolute return hedge funds (HFRX Absolute Return Index), equity hedge funds (HFRI Equity Hedge (Total) Index), venture capital (CA US Venture Capital Index), private equity (CA US Private Equity Index), Treasuries (Bloomberg Government Bond Index), and investment grade credit (Bloomberg Corporate Investment Grade Bond Index).
LHS chart reflects AACRs over the respective periods. In RHS chart, “Dispersion” is the rolling three-year average of the monthly S&P 500 dispersion. Dispersion is calculated as the weighted cross-sectional standard deviation of the performance of stocks within the index for one month. Equity long/short manager return spreads reflect the rolling three-year excess returns (net of fees) versus the HFRI Equity Hedge Index. Percentiles based on all equity long/short managers in our database.
Pooled private investment periodic returns are net of fees, expenses, and carried interest. Private equity includes buyouts and growth equity. Modified Public Market Equivalent (mPME) replicates private investment performance under public market conditions. The public index’s shares are purchased and sold according to the private fund cash flow schedule, with distributions calculated in the same proportion as the private fund, and mPME NAV is a function of mPME cash flows and public index returns. MSCI All Country World Index (ACWI) returns are net of dividend withholding tax.
The Bloomberg Commodity Index is made up of 24 exchange-traded futures on physical commodities, representing 22 commodities that are weighted to account for economic significance and market liquidity. Weighting restrictions on individual commodities and commodity groups promote diversification.
The Bloomberg US Corporate Bond Index measures the investment grade, fixed-rate, taxable corporate bond market. It includes USD-denominated securities publicly issued by US and non-US industrial, utility, and financial issuers. The index is a component of the US Credit and US Aggregate Indexes, and provided the necessary inclusion rules are met, US Corporate Index securities also contribute to the multi-currency Global Aggregate Index. The index includes securities with remaining maturity of at least one year. The index was created in January 1979, with history backfilled to January 1, 1973.
The Bloomberg US Corporate High Yield Index measures the US corporate market of non-investment grade, fixed-rate corporate bonds. Securities are classified as high yield if the middle rating of Moody’s, Fitch, and S&P is Ba1/BB+/BB+ or below.
The Bloomberg US Government Inflation-Linked Bond Index measures the performance of the US Treasury Inflation Protected Securities (TIPS) market. The US Government Inflation-Linked Bond Index is subset of the flagship Bloomberg World Government Inflation-Linked Bond (WGILB) index and US TIPS represent the largest component of the WGILB Index. The US Government Inflation-Linked Bond Index includes the total amount outstanding of each TIPS and does not adjust for amounts held in the Federal Reserve System Open Market (SOMA) Account. The US Government Inflation-Linked Bond Index was launched in May 2002, with history backfilled to February 1997.
The Bloomberg US TIPS Index is a rules-based, market value–weighted index that tracks inflation protected securities issued by the US Treasury.
The Dow Jones US Oil & Gas Index is designed to measure the stock performance of US companies in the oil & gas sector.
Equity Hedge: Investment Managers that maintain positions both long and short in primarily equity and equity derivative securities. A wide variety of investment processes can be employed to arrive at an investment decision, including both quantitative and fundamental techniques; strategies can be broadly diversified or narrowly focused on specific sectors and can range broadly in terms of levels of net exposure, leverage employed, holding period, concentrations of market capitalizations and valuation ranges of typical portfolios. EH managers would typically maintain at least 50% exposure to, and may in some cases be entirely invested in, equities, both long and short. The HFRI Monthly Indices (“HFRI”) are a series of benchmarks designed to reflect hedge fund industry performance by constructing composites of constituent funds, as reported by the hedge fund managers listed within HFR Database.
Hedge Fund Research, Inc. (HFR) uses a UCITSIII compliant methodology to construct the HFRX Hedge Fund Indexes. The methodology is based on defined and predetermined rules and objective criteria to select and rebalance components to maximize representation of the Hedge Fund Universe. HFRX Indexes use state-of-the-art quantitative techniques and analysis; multi-level screening, cluster analysis, Monte-Carlo simulations and optimization techniques ensure that each Index is a pure representation of its corresponding investment focus.
The MSCI ACWI captures large- and mid-cap representation across 23 developed markets (DM) and 24 emerging markets (EM) countries. With 2,558 constituents, the index covers approximately 85% of the global investable equity opportunity set. DM countries include Australia, Austria, Belgium, Canada, Denmark, Finland, France, Germany, Hong Kong, Ireland, Israel, Italy, Japan, the Netherlands, New Zealand, Norway, Portugal, Singapore, Spain, Sweden, Switzerland, the United Kingdom, and the United States. EM countries include Brazil, Chile, China, Colombia, Czech Republic, Egypt, Greece, Hungary, India, Indonesia, Korea, Kuwait, Malaysia, Mexico, Peru, the Philippines, Poland, Qatar, Saudi Arabia, South Africa, Taiwan, Thailand, Turkey, and the United Arab Emirates.
Footnotes
- Comparisons of private investments and public investments are not quite apples-to-apples. We show private investment manager returns using horizon returns based on internal rates of return and compare them to time-weighted returns for liquid investments. While imprecise, the analysis is directionally correct and consistent with our investment experience.
- We assume both portfolios have a beginning market value of $100 million and spend 5% of a 12-quarter moving average of ending market values.
About Cambridge Associates
Cambridge Associates is a global investment firm with 50+ years of institutional investing experience. The firm aims to help pension plans, endowments & foundations, healthcare systems, and private clients implement and manage custom investment portfolios that generate outperformance and maximize their impact on the world. Cambridge Associates delivers a range of services, including outsourced CIO, non-discretionary portfolio management, staff extension and alternative asset class mandates. Contact us today.