How Much Return Do We Need? Aligning the Investment Strategy with the Mission for Healthcare Systems
Over the last few decades, many not-for-profit healthcare systems have enjoyed strong margins driven by favorable demographic trends, inexpensive debt, and improved cost structures through mergers & acquisitions. As a result, many of those systems have been able to amass significant investable reserves. However, in many cases the purpose of the investment portfolio is often vague or ill-defined. Is the goal to outperform the cost of debt? To preserve or grow days cash on hand (DCOH)? To support operations or projects through periodic spending? Some combination of all the above?
Without clearly defining the purpose of the investment portfolio, it is impossible to determine its return objective—and, by extension, what risks are necessary to achieve it. In a changing operating environment where expenses are elevated, margins remain strained, and the cost of debt has risen, healthcare systems that are able to clearly identify the investment portfolio’s role in supporting their missions—and to understand the returns necessary to support that role—are more likely to meet with success.
In this paper, we will examine the returns required to support various objectives of an investment portfolio, focusing on three of the most common:
Objective 1: Preserving or growing DCOH to bolster debt rating
Objective 2: Outperforming the cost of debt to optimize capital efficiency
Objective 3: Spending to offset operating shortfall or meet capital needs
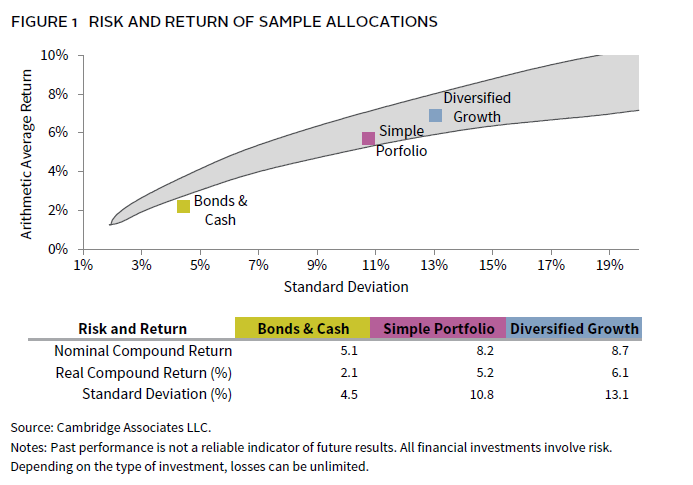
We will compare each of these objectives against the expected return of three allocation approaches with broadly different risk, return, and liquidity characteristics (Figure 1).
- Bonds & Cash, a conservative portfolio of 60% bonds/40% cash, effectively representing a low-risk approach.
- Simple Portfolio, which introduces equity exposure with a 60/40 mix of equities and bonds.
- Diversified Growth, a more equity-oriented portfolio broadly diversified across public equity (40%), private investments (25%), hedge funds (15%), and bonds (20%).
Objective 1: Preserving or Growing Days Cash on Hand
Days cash is a critical metric of a system’s health and an important factor in supporting its debt rating. Considering that fact, some systems view the role of the investment portfolio as preserving a given DCOH number and may invest it to defend that number rather than risk any decline in days cash.
However, while the value of a defensive portfolio may not change much over time, the costs needed to run the system do; median expense growth has come down from the double-digit highs of 2022, but the long-term average is still expected to be close to 6%. This means that unless unrestricted assets are growing more than ~6% per year—or there are significant inflows to the portfolio from operations—the DCOH number is more likely to erode than improve over time.
So, what is required to generate a 6%+ return? Even when cash was yielding 5.5%, it still fell short of that target, and if interest rates continue to fall it will require even more risk to achieve it. The good news is this should be achievable if a healthcare system is willing to take some equity risk. Figure 1 shows that both the Simple Portfolio and Diversified Growth allocations should generate at least a nominal return sufficient to outpace expense inflation of 6%. Only the Bonds & Cash portfolio fails to keep pace.
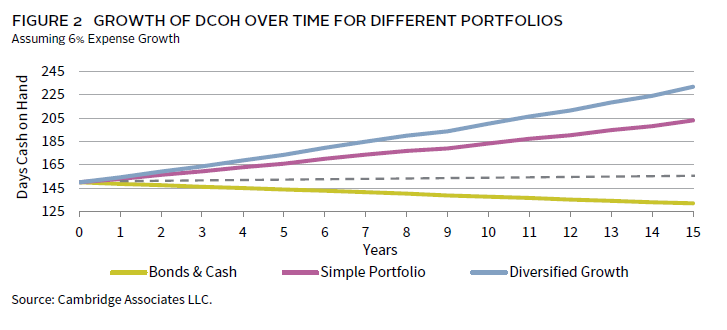
While 6% may be a good proxy for the return required to preserve real DCOH, what if the objective is to grow it? Assuming all other operating metrics remain constant, clearly the higher the return, the faster the DCOH will grow. Figure 2 shows the growth of DCOH over 15 years for a hypothetical healthcare system with $1 billion in unrestricted assets representing 150 DCOH, and assuming expense growth of 6%. While both equity-oriented allocation approaches grow DCOH, the Diversified Growth allocation (with 232 DCOH) ends the period with almost 30 more days cash than the Simple (203 DCOH), and 100 more days than Bonds & Cash (132 DCOH).
Objective 2: Outperforming the Cost of Debt
The use of debt plays a critical role in funding capital needs for most not-for-profit systems. But for those systems with large unrestricted reserves, debt is not the only option. The decision to fund capital needs from debt or reserves effectively comes down to whether the expected return on investments is higher than the cost of debt. As long as that is the case, it is typically cheaper to use debt funding and allow invested reserves to keep growing.
Over the past several years, that decision has been an easy one, as the cost of debt was historically low and market returns historically high. For example, the ten-year annual compound return of a 60/40 portfolio between 2011 and 2021 was more than 11%, while the typical cost of ten-year debt for a highly rated healthcare system was often below 4%—earning a premium over the cost of debt of more than 700 basis points (bps). But what are the implications for an environment where the cost of debt is rising?
Many systems took advantage of the low-rate environment prior to 2022 to term out debt at attractive rates. But for those that need to take on new debt or refinance at higher rates, the environment looks very different going forward. While short-term rates have come down slightly since 2023, long-term rates may remain elevated in the absence of an economic slowdown.
Unfortunately, it is impossible to predict either the future direction of interest rates or the performance of capital markets over the next ten years, but it seems likely that the spread between portfolio returns and the cost of debt is likely to narrow in the near term. Rather than attempt to predict the future, it may be more useful to gauge what the impact of a narrowing spread might be on growth of system assets to help weigh whether seeking higher return from the portfolio is warranted.
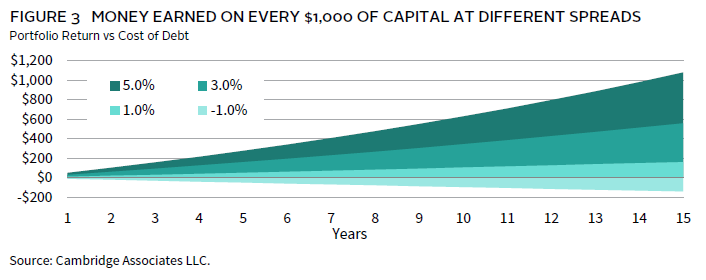
Figure 3 shows that for every $1,000 invested, a portfolio return spread of 1% above the cost of debt adds $161 to aggregate system assets over 15 years, while a spread of 5% adds $1,079—a meaningful difference. While we would not advocate increasing risk in the long-term investment portfolio (LTIP) simply to boost returns all else being equal—particularly when higher debt costs may already be placing additional strain on the system—it may be worth considering whether the system can prudently afford to assume additional risk in the portfolio to increase that spread and put the balance sheet in a stronger position over time.
Assuming that rates on long-term debt remain around 4%–5% for the near future, given the average expected return for each allocation in Figure 1, it would be a struggle for the Bonds & Cash portfolio allocation to keep pace with the cost of debt. Meanwhile, both equity-oriented allocations should offer a buffer of around 350 bps–450 bps. That’s a far cry from the 700 bps achieved in the 2010s, but could still have a meaningful impact on the cost of capital decision for healthcare systems that can afford to take any equity risk.
Objective 3: Spending to Offset Operating Shortfall or Meet Capital Needs
For most systems, capital has historically flowed from operations into reserves, but the operating stresses of the COVID-19 pandemic and skyrocketing costs led many to dip into their unrestricted investment portfolios to plug margin gaps, fund pensions, or finance strategic objectives. While margins have generally continued to improve since 2022, it may still be some time before the average rises above 1%–2% across the industry. Some systems may need to lean on spending from their reserves to meet system objectives until things improve, particularly if current policy and cost-cutting measures under consideration by the federal government are put in place.
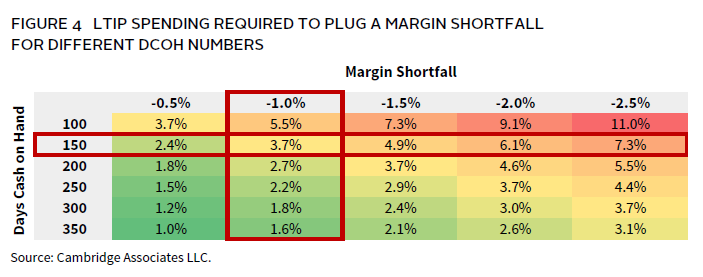
Fortunately, depending on the severity of the margin shortfall and the strength of a system’s balance sheet, demands on the portfolio may be modest. Figure 4 shows that for the system described above with 150 DCOH and $1 billion in unrestricted assets, an operating margin of -1% would require spending of only ~3.7% from the portfolio to plug the gap. However, a -2.5% margin for the same system would require a spend of 7.3% to break even. Figure 4 also illustrates that the higher a system’s DCOH number is, the lower the effective spending rate required from the portfolio to support a given margin shortfall.
Even in the absence of margin shortfalls or one-off spending needs, some systems may decide to make regular annual spending a systematic source of support for strategic objectives. But whether spending is sporadic or consistent, it is critical for systems to understand the level of withdrawals that a given asset allocation can sustain without doing long-term damage to the real value of the portfolio. Here the concept of “net flow”—the sum of outflows from the portfolio and inflows from operations or other sources—may be useful. For example, if a system is spending 5% from the portfolio but inflows equal 3%, then the net flow is only 2%. But if a system is spending 5% with no offsetting inflows, then its odds of preserving real purchasing power will decline all else being equal.
Figure 5 looks at the impact of different average net flow rates on each of the model portfolios described above in terms of real (net of inflation) purchasing power. For our inflation assumption in Figure 5, we have used the long-term average CPI rate of 3%.
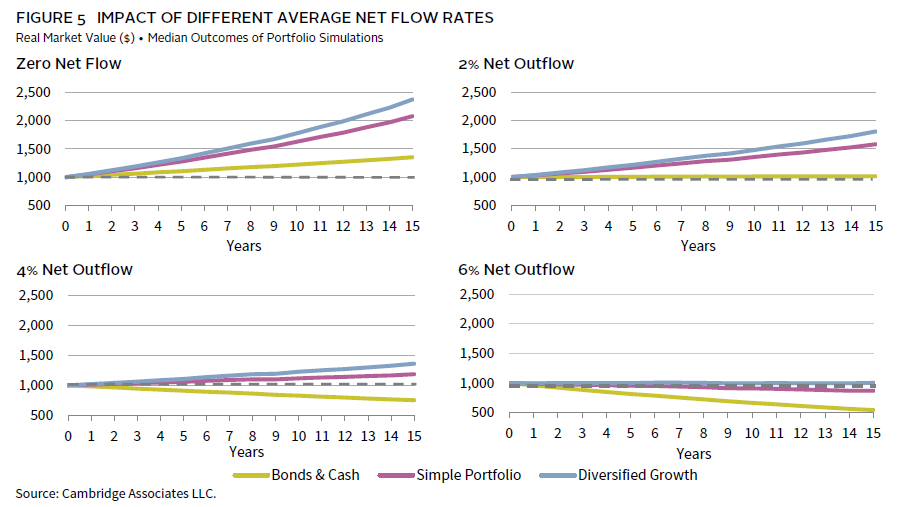
With zero outflows, all three of these allocation approaches should be able to grow purchasing power over time net of 3% inflation. After introducing an average net outflow of 2%, both the equity-oriented portfolios can grow real purchasing power, while the Bonds & Cash allocation declines in real value. However, once net outflows approach or exceed 5%, it requires an increasingly higher equity orientation to preserve the real value of the portfolio—at 6% net outflow, even the Diversified Growth allocation is barely able to tread water.
While the long-run CPI inflation rate of 3% may be a good estimate of the national average, as noted above the average cost inflation for healthcare systems is consistently higher. If we instead use the 6% expense growth assumption employed in Figure 2, then preserving real purchasing power net of spending becomes much harder for all three portfolios. Figure 6 uses all the same inputs as Figure 5, but simply adjusts inflation from 3% to 6%.
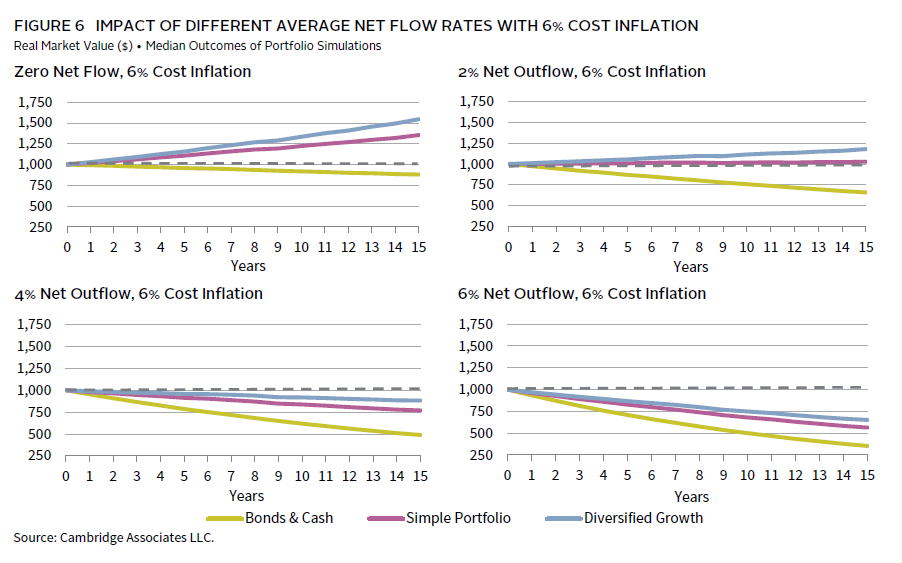
At 6% cost inflation, any net outflows from the portfolio makes preserving its real purchasing power that much harder. At a 2% net outflow, only the two equity-oriented allocations have much of a chance of maintaining real value net of inflation. But once net outflows exceed just 3%, none of the three allocations can keep up with inflation of 6%.
Of course, inflation is notoriously difficult to estimate and even harder to predict—3% may be too low an estimate, and 6% may be far too high. But before a system decides on a plan for making withdrawals from the portfolio—whether regular or sporadic—it must make an honest assessment of likely expense inflation over time, weigh the needs for the withdrawals against their potential long-term impact on the real value of the portfolio, and identify an asset allocation likely to preserve that value net of withdrawals and cost inflation.
A Little From Column A, a Little From Column B
The real challenge comes for those systems that need to use their investment reserves to achieve some combination of the goals above. While both the Simple and the Diversified Growth allocations’ expected returns should be enough to both outperform the cost of debt and grow days cash, once any spending is introduced, it becomes much harder to meet any combination of those objectives.
Balancing the dual objectives of spending and outperforming the cost of debt requires careful consideration, as any level of spending directly reduces the portfolio’s effective return by the same amount. For instance, a portfolio generating a 6% return with a 2% spending rate results in an effective return of 4%, thereby increasing the challenge of exceeding the cost of debt. However, since spending may be the result of a decision to use reserves instead of debt for capital needs, that goal may be less relevant for those who spend.
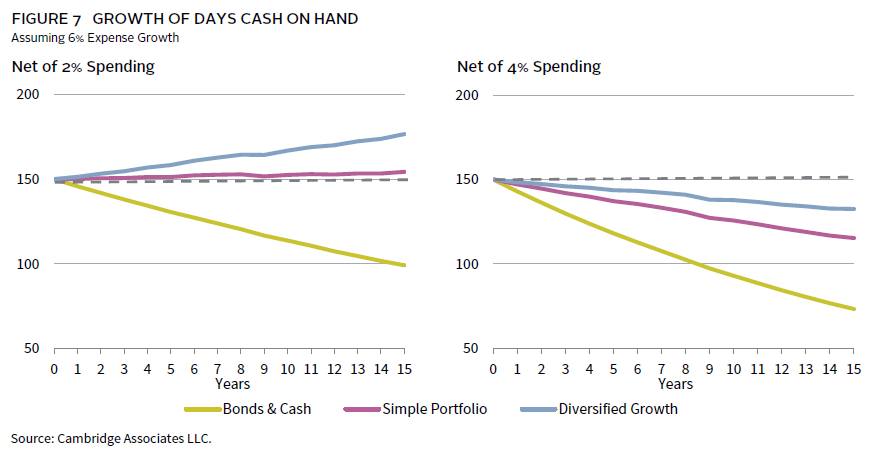
Measuring the impact of spending on days cash is a bit more straightforward. Figure 7 looks at the impact of spending on the same $1 billion investment pool described above, with a starting DCOH number of 150. Spending an average of just 2% effectively eliminates any DCOH gains for the Simple allocation, although the Diversified Growth allocation still manages to eke out a material gain. However, once spending consistently rises to 4% or above, the DCOH number begins to decline over time for all three allocation approaches.
Conclusion
With all else being equal, the higher the expected return of the investment portfolio, the better situated a healthcare system will be over the long run, increasing days cash, improving the cost of capital, and providing the system with greater operating flexibility. Of course, the flip side of return is risk. Systems must think carefully about how much volatility and illiquidity can be safely assumed in the LTIP without jeopardizing operations by stress testing possible scenarios combining operating and market stress—2022 was a good example of such an environment.
As the healthcare industry and capital markets continue to evolve, it will become increasingly critical for healthcare systems to clearly identify what role they want their investable reserves to play in supporting the enterprise. Clearly defining the financial objectives of the investment portfolio allows the system to define the return objectives—and attendant risk—required to achieve them. Just as importantly, it allows the system to level-set expectations for the portfolio across the organization, significantly reducing the risk of making the wrong decision at the wrong time when markets inevitably misbehave.
Hamilton Lee, Co-Head of Healthcare Practice
Graham Landrith also contributed to this publication.
About Cambridge Associates
Cambridge Associates is a global investment firm with 50+ years of institutional investing experience. The firm aims to help pension plans, endowments & foundations, healthcare systems, and private clients implement and manage custom investment portfolios that generate outperformance and maximize their impact on the world. Cambridge Associates delivers a range of services, including outsourced CIO, non-discretionary portfolio management, staff extension and alternative asset class mandates. Contact us today.