VantagePoint: As the Narratives Turn
When investors doubt prevailing narratives, volatility tends to increase, with pricey and leveraged markets most at risk. This was the setting in July and early August as cracks formed in the narratives around artificial intelligence (AI) growth and an economic soft landing. The loss in faith amid high valuations amplified the decline as the Japanese yen carry trade positioning unwound. Recent volatility provides a useful reminder that investors are best served by relying on a well-constructed asset allocation, sticking to a predetermined rebalancing policy, and monitoring liquidity sources and uses. Risks can build in the system and then erupt in unexpected ways. As such, discipline is necessary for long-term success in meeting investment objectives.
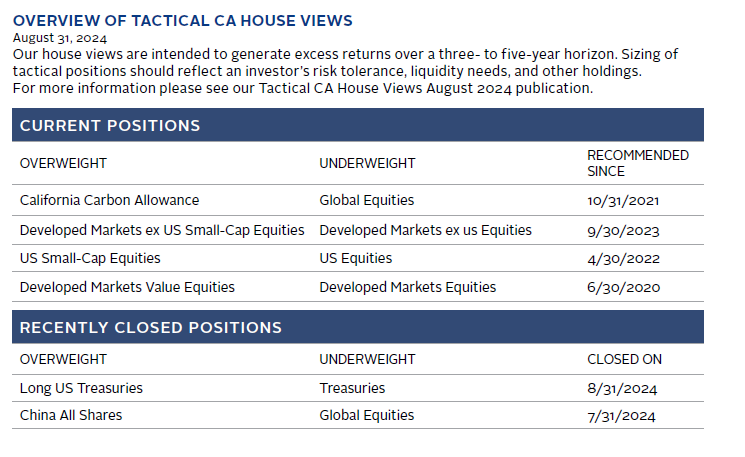
In this edition of VantagePoint, we find that consumers, corporations, and the banking sector remain in good shape, and while US/global economic growth is likely to slow in the second half of 2024 relative to the first, we expect it will remain positive. Although market concentration risk is elevated, given its focus on highly profitable AI-related tech stocks, we would seek to be measured about diversifying such risks. We recommend modest, risk-controlled tilts away from mega-cap tech stocks toward more attractive developed markets small-cap and value stocks. We review the importance of consistent risk management practices including diversification and liquidity management. Fortunately, there are attractive investments that can provide portfolio resilience and be additive to long-term performance. Further, liquidity management can help investors maintain their strategic direction in the face of equity market downturns by providing confidence in the ability to meet cash needs for spending, taxes, rebalancing, and capital calls.
Keeping Track of the Plot
Markets have been laser focused on economic data, creating volatility around data releases. Leveraged and crowded positions have been particularly vulnerable, especially as the unwinding of the Japanese yen carry trade led to deleveraging and general de-risking.
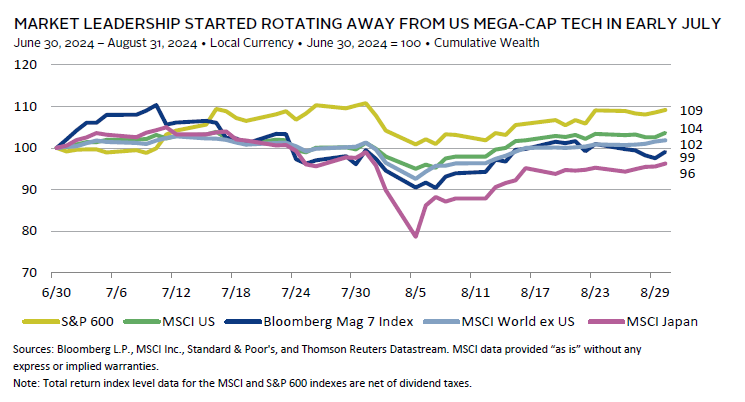
Change has been afoot since the surprisingly soft July 11 US Consumer Price Index report sparked a market rotation. As Treasury yields fell amid rising expectations of US central bank easing and a soft landing, unloved small-cap stocks and global value stocks outperformed the AI darlings that had dominated the market. US small-cap stocks were also boosted by rising expectations for a Trump presidency and a Republican sweep of Congress prior to President Biden pulling out of the race.
The tide shifted again on August 2 after a weak US labor report renewed recession expectations. The Japanese yen carry trade unwound as the yen spiked, supported by tighter interest rate differentials between US Treasuries and Japanese government bonds that had already begun narrowing after a Bank of Japan (BOJ) rate hike in late July. As equities broadly sold off, mega-cap tech stocks did not resume their leadership. For the first five days of August, both the Magnificent 7 (Mag 7) and US small caps underperformed equities outside the United States, while Japanese equities suffered disproportionately. US Treasury yields proved defensive, with the ten-year yield falling more than 20 basis points during the depths of the equity sell-off.
Equity markets have largely returned to previous levels, although mega-cap tech stocks and Japanese equities remain below recent high-water marks. The recovery was helped along as BOJ officials sought to settle markets by signaling a gradual approach to monetary policy tightening that is sensitive to volatility, and firmer US data releases also supported markets.
Slowing Inflation and Softening Economic Data
Global economic data have been holding up well this year as inflation has continued to decelerate, although there have been some signs of softening, particularly in China and Europe. Data for the United States have been mixed, but reflective of a slowing economy, not a recession. Recent concerns have focused on the labor market, where the unemployment rate has gradually increased, jobless claims have risen, and job growth has decelerated. Labor market conditions are consistent with an expanding economy, but the rate of change has caused concerns that further deterioration is on the horizon. The Sahm rule has been triggered at a 0.5-percentage point increase in the three-month average unemployment rate from its recent low. This has historically led to a substantial rise in unemployment and eventually a recession. Much of the recent rise in unemployment has been due to increased labor force participation rather than layoffs, putting the utility of the measure in question.
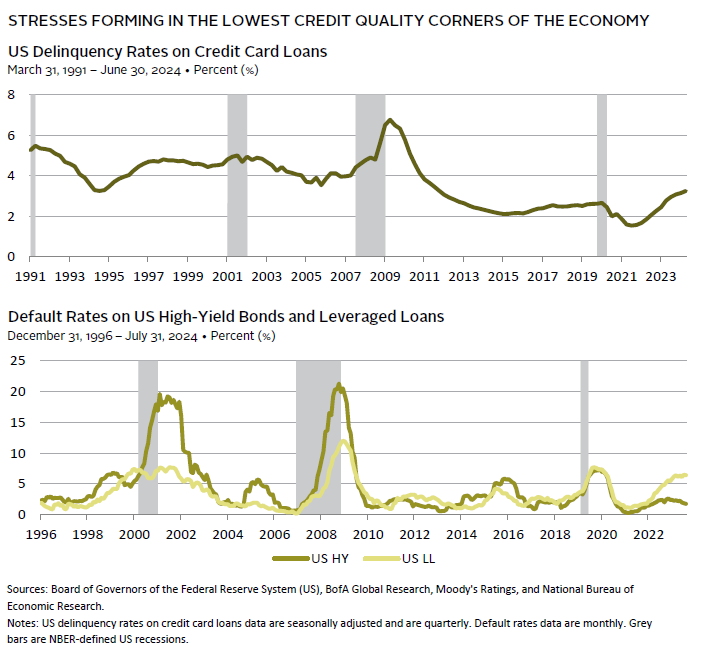
Still, slightly softer growth and a more mixed economic outlook suggest recession risks have risen, as confirmed by consensus expectations. There has also been some deterioration in the weakest segments of the economy, as reflected in the rise in defaults rates on credit cards and non–investment-grade debt.
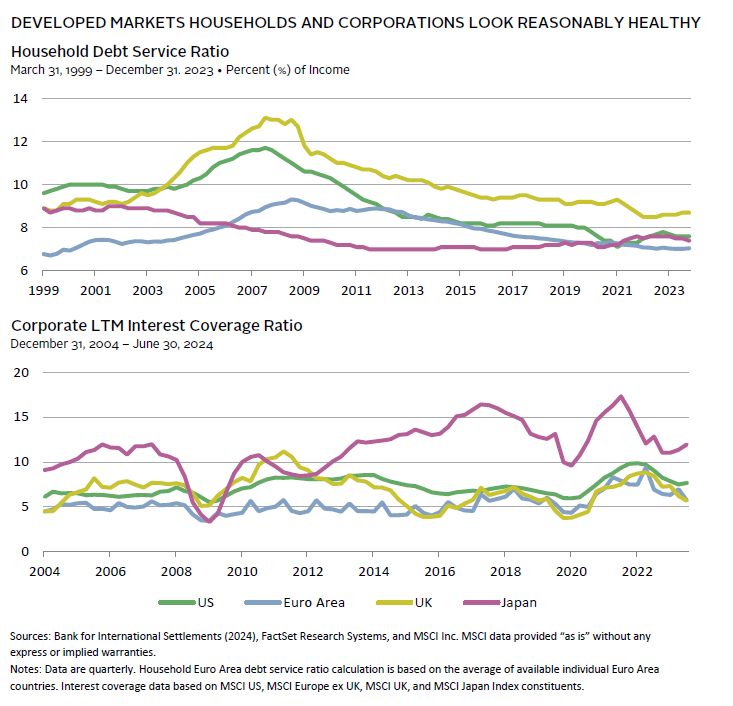
The Fed has considerable flexibility to address economic weaknesses should a recession develop, with the Fed funds rate target between 5.25% and 5.5%—the highest in 22 years. Furthermore, US households and corporations are in a better position today than they have been heading into previous slowdowns, which should help support growth. For example, the vast majority of US households and investment-grade, non-financial corporations are healthy with reasonable interest coverage. Banks are also better capitalized following increased regulatory requirements, particularly for large, systemically important banks. This could certainly change with a sharp increase in unemployment, but this is not our base case.
Market Concentration and the Magnificent 7
The second major market narrative that has been shifting is the faith in the Mag 7 stocks. This group of stocks is central to the broad market’s performance as it accounts for about 20% of global equities and 30% of the S&P 500 market capitalization. This transformation has been driven by exceptionally strong relative performance. Over the last 15 years, US equities have accounted for 58% of developed markets equity returns, with roughly half of the US return attributable to the tech and interactive media sectors, according to analysis by Empirical Research Partners.
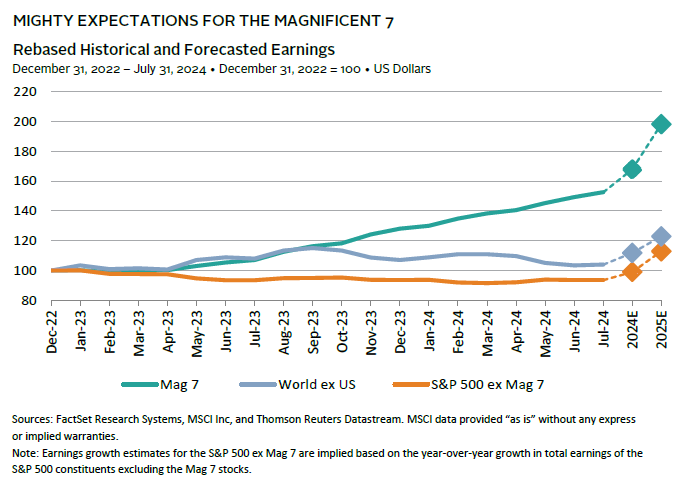
In recent years, returns have been driven by tech stocks’ relative earnings strength, particularly Nvidia and most of the Mag 7. In fact, if you exclude the Mag 7, earnings growth for US stocks have lagged that of other developed markets, although US stocks are expected to catch up again in the next year or two. While earnings growth for the Mag 7 has been exceptional, the scale of capex and research and development (R&D) spending by these firms on AI initiatives have raised doubts about the ability of AI applications to deliver a return on investment that can support continued elevated earnings growth.
Investors are right to be concerned. Disruptive innovation cycles create vast opportunities, the scope and timing of which are difficult to estimate. During the technology and telecommunications boom, real capital expenditures increased at a rate of 12% per year from 1991 to 2000. As much as 95% of installed fiber-optic cable remained unused immediately following the bursting of the technology, media, and telecom (TMT) bubble, which forced overleveraged telecommunications out of business. AI spending has been significant, with Mag 7 capex and R&D spending totaling $419 billion in 2023, accounting for about 20% of S&P 500 capex and 40% of reported R&D with more expected in the next few years.
However, there are important differences between the TMT bubble and the current buildout of AI. In contrast to the overleveraged telecommunications firms of the TMT bust, most of the Mag 7 benefits from high free cash flow margins and squeaky-clean balance sheets. At the height of the tech bubble, TMT stocks were spending more than 100% of operating cash flows on capex and R&D. In contrast, today’s mega-cap tech companies’ capex and R&D as a share of cash from operations is 72%, close to the 40-year median of 67%. Should development of profitable applications using AI disappoint, high valuations will not be sustained. However, investors are not taking a solvency risk, but rather a concentrated risk, which can be managed. Given the strength of these companies and their promising prospects, we would tightly manage underweights, tilting modestly into more attractively valued segments of the market.
A Plethora of Additional Risks
There is no shortage of risks for investors to consider. For example, commercial property markets, particularly office, present opportunities for stress that will intensify should interest rates remain elevated or increase from current levels. High sovereign debt as a share of GDP presents another challenge. Episodes of market stress related to sovereign debt largesse were briefly experienced in the UK gilt market during Liz Truss’s brief stint as prime minister and in the French OAT market around the French parliamentary election. US debt is also elevated; however, as the reserve currency, the United States benefits from steady demand associated with global trade and lending, with no apparent competitor at the ready to displace the US dollar. Volatility tied to disruptive secular forces like AI transformations, climate change and energy transition, shifting supply chains, inflation, and broader geopolitical and political strains also pose risks. These risks will likewise bring opportunities for investors that closely study the shifting landscape and partner with asset managers that bring diverse perspectives that can help identify varied opportunities in a changing and dynamic landscape.
Key Components of Risk Management
While economic conditions appear solid, economic growth has slowed and default rates on weak credits have increased even as they remain low. The severity of the yen carry trade unwinding—while brief—highlights that risks can accumulate in the system and manifest unpredictably. The foundation of a successful investment strategy is careful portfolio construction and liquidity risk management, not rash reactions to market volatility.
Layer Diversification
Well-constructed portfolios are designed to meet long-term and near-term return objectives, while maintaining adequate diversification and liquidity sources to manage through challenging downturns. Too much diversification into ultra-safe assets, and portfolio return objectives may not be met, while too little could result in permanent loss of capital if a meaningful share of risky assets must be sold at depressed prices to meet spending needs.
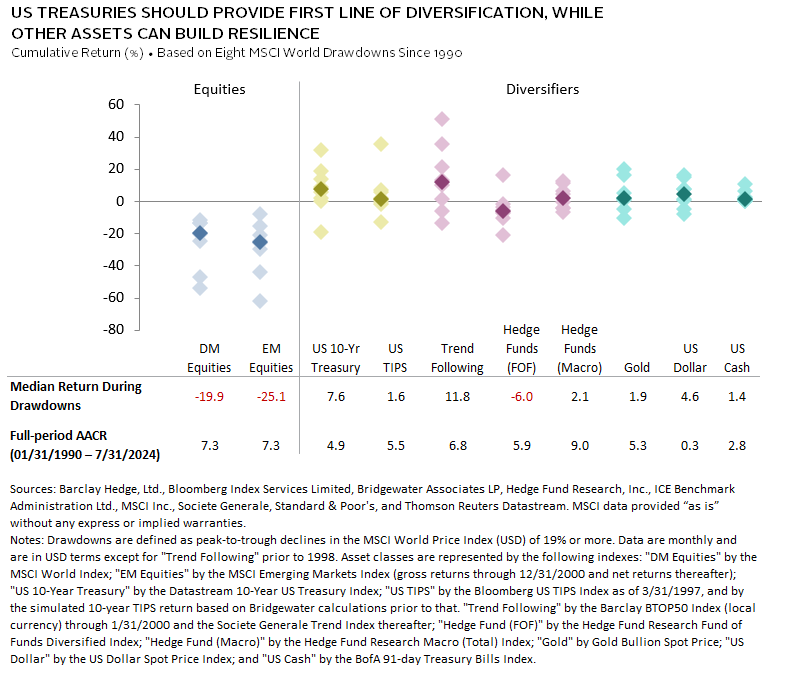
The most reliable and efficient form of portfolio diversification is high-quality bonds, particularly US Treasury yields. Given these diversification characteristics and reasonable valuations at current yields, we recommend maintaining a neutral exposure to Treasury yields relative to policy targets. Cash can also provide more stability, but generally at a high opportunity cost. Holding cash has been additive to portfolios as the yield curve has been inverted, but low long-term return expectations and the lack of upside potential during periods of stress make longer-duration Treasury yields a more useful diversifier.
Inflation-linked sovereign bonds (ILBs) provide an interesting supplement to nominal sovereign bonds today, given still-elevated real yields and their ability to serve as a viable hedge against inflation, while also contributing to portfolio resilience in a variety of economic outcomes. ILBs are less volatile and higher returning than most inflation-sensitive assets, but they are less liquid than nominal sovereign bonds and have faced pressure during previous periods of stress. Similarly, global macro hedge funds and trend-following strategies can be useful diversifiers as a second layer of defense in portfolios. Such strategies have the potential to be long volatility when equities are under stress, while trend following can also provide diversification against varied risks, especially for strategies that cover a variety of markets. These strategies are less reliable than high-quality sovereign bonds and require thoughtful manager selection and portfolio construction but are worth the effort in building resilient diversification.
Embrace Optionality
One component of diversification we like today are strategies that offer optionality—good return prospects across the economic cycle with potential to outperform during periods of stress or distress. Equity long/short (ELS) is one such example. ELS hedge funds have increased in appeal in the last year but have seen dwindling portfolio allocations among investors. As we noted in our 2024 Outlook, the lifting of some structural factors that have held ELS hedge funds back since the Global Financial Crisis (GFC)—low interest rates, muted volatility, and exceptional long-only equity returns—have faded. Most notably, the short rebate exceeds dividend yields by the widest margin since 2001, marking a more favorable environment for short sellers. Further, our expectations that weaker economic growth will lead to more dispersion in corporate fundamentals, while secular shifts related to supply-chain adjustments and technological innovation create opportunities for highly skilled managers to add value on the long and short sides of their books, providing diversification to portfolios and adding alpha.
A variety of uncorrelated strategies (e.g., insurance-related strategies) can offer helpful diversification by taking a range of risks less dependent on economic growth. The key challenges with these investments are the steep learning curve required for due diligence and their tendency to be somewhat illiquid. Even seemingly liquid strategies—like many absolute return–oriented hedge funds—chose to gate investors from accessing funds during the stress that followed the GFC. These strategies often need to be thought of as providing long-term diversification rather than as a source of liquidity to tap during times of stress.
Diversify Some Equity Concentration Risk
As noted above, global equities have become increasingly concentrated, making diversification within equities an important part of risk management. The concentration and level of valuation warrants tilting away from these names. Yet, the strength and growth prospects of these companies drives us to do so in a tightly risk-managed fashion. Many portfolios already have sufficient underweights relative to market benchmarks given the use of active managers. Active managers tend to both differentiate bets within Mag 7 names and hold more equal-weighted portfolios. While non-US equities offer cheaper valuations than US equities, US equity valuations are less elevated once we exclude the Mag 7. We expect tilting toward value and small caps in developed markets will add more value to portfolios than overweighting non-US developed markets. Within small caps, we focus on higher quality, particularly in the US market where a greater share of small caps has no—or negative—earnings.
Dynamic Liquidity Management
A critical dimension of risk management is provisioning for cash sources during times of stress to meet spending, tax, capital calls, or rebalancing needs. Portfolios have become less liquid as investors shifted from traditional stocks and bonds to private investments. Endowments with more than $500 million now hold 34% in private investments, up from 23% a decade ago, with uncalled capital commitments equal to 16% of portfolio market value. Larger private equity allocations can enhance returns but also increase illiquidity risks in downturns.

Not only have allocations to illiquid assets increased, but the liquidity of such assets has diminished. For example, the number of years until global venture capital investors receive distributions equal to invested capital has increased from the eight to nine years experienced in 2010–14. On average, global venture capital funds of vintage year 2015 and beyond have not yet reached this milestone. A stagnant IPO market and the preference of many private companies to stay private for longer perpetuate this trend, although the rapid growth of continuation vehicles and the deepening secondary market offer increasing exit opportunities. These shifts necessitate increased liquidity planning, especially for institutions with significant annual spending needs and investments with lock-ups. A slower distribution pace also requires a slowing of commitment pace needed to meet or maintain policy target allocations and the ability for private investment programs to be self-financing.
To properly provision for liquidity needs, investors need to consider three dimensions of liquidity that can shift in times of stress: 1) portfolio liquidity; 2) access to liquidity outside the portfolio from reserves, debt capacity, charitable donations, revenue, or earnings; and 3) spending needs. During market downturns, portfolio asset liquidity diminishes as funds with gating provisions will lower gates, private investments make distributions more slowly relative to the pace of capital calls, and bid-ask spreads of less liquid markets widen, requiring larger discounts to transact. Downturns can have systemic impacts, affecting bond issuers’ credit ratings and increasing borrowing costs. Institutions relying on charitable giving or cyclical revenues may see contributions drop during downturns, just when spending needs rise. Colleges and universities already facing demographic challenges can see their revenues further pressured. Potential changes in tax circumstances should also be considered. Spending needs from long-term assets can increase, especially if other revenue/income sources decline, and at a minimum are likely to remain constant in terms of absolute amounts such that spending represents a higher share of asset values.
Investors with significant allocations to illiquid funds should stress test their portfolios and develop a plan for sourcing and using available liquidity during the next downturn. Our primer on liquidity management can provide a helpful guide to liquidity stress testing.
Conclusion
While economic growth is slowing, the fundamentals of consumers, corporations, and the banking sector remain robust. Recent market volatility underscores the importance of adhering to a well-constructed asset allocation, consistent risk management practices, and vigilant liquidity management. We would maintain strategic exposures to equities while reviewing equity concentration risk, the construction of diversifying assets, and liquidity sources and uses to make sure they are fit for purpose in the current environment.
We would modestly diversify concentration risk in equity markets as AI-related tech stocks offer secular appeal but are richly valued. Using active managers will naturally provide some diversification. Our tactical tilts to more attractively valued developed markets small-cap and value stocks can provide further diversification. As yields have settled at higher levels than we have seen in recent years, a wider range of diverse exposures have become more attractive. High-quality nominal sovereign bonds and ILBs, trend following, and global macro hedge funds offer valuable diversification. Additionally, strategies that provide optionality—such as ELS and less economically sensitive strategies—can enhance portfolio resilience.
Dynamic liquidity management is crucial, especially for investors with significant allocations to private investments. While the current market environment presents numerous challenges, it also offers opportunities for those who are prepared. By focusing on diversification that includes value added opportunities, liquidity management, and strategic asset allocation, investors can build resilient portfolios capable of weathering economic storms and achieving long-term success.
Celia Dallas, Chief Investment Strategist
Grayson Kirk and Ilona Vdovina also contributed to this publication.
Barclay BTOP5O Index
The BTOP50 Index seeks to replicate the overall composition of the managed futures industry with regard to trading style and overall market exposure. The BTOP50 employs a top-down approach in selecting its constituents. The largest investable trading advisor programs, as measured by assets under management, are selected for inclusion in the BTOP50. In each calendar year the selected trading advisors represent, in aggregate, no less than 50% of the investable assets of the Barclay CTA Universe.
Bloomberg Magnificent 7 Index
The Bloomberg Magnificent 7 Total Return Index is an equal dollar–weighted equity benchmark consisting of a fixed basket of seven widely traded companies classified in the United States and representing the communications, consumer discretionary, and technology sectors as defined by the Bloomberg Industry Classification System (BICS).
Bloomberg US TIPS Index
The Bloomberg Barclays US TIPS Index is a rules-based, market-value weighted index that tracks inflation protected securities issued by the US Treasury.
BofA Merrill Lynch 91-Day Treasury Bill Index
The BofA Merrill Lynch 91-Day Treasury Bill Index is an unmanaged index that tracks the performance of Treasury bills.
Gold Bullion Spot Price PM Fix
The spot price of gold is the most common standard used to gauge the going rate for a troy ounce of gold. The price is driven by speculation in the markets, currency values, current events, and many other factors. Gold spot price is used as the basis for most bullion dealers to determine the exact price to charge for a specific coin or bar. These prices are calculated in troy ounces and change every couple of seconds during market hours.
HFRI Fund-of-Funds Diversified Index
The HFRI Fund-of-Funds Diversified Index is a non-investable product of diversified fund-of-funds. The index is equal weighted (fund weighted) with an inception of January 1990.
HFRI Macro (Total) Index
The HFRI Macro (Total) Index includes macro investment managers, which trade a broad range of strategies in which the investment process is predicated on movements in underlying economic variables and the impact these have on equity, fixed income, hard currency, and commodity markets. Managers employ a variety of techniques, both discretionary and systematic analysis, combinations of top down and bottom up theses, quantitative and fundamental approaches, and long- and short-term holding periods. Although some strategies employ RV techniques, macro strategies are distinct from RV strategies in that the primary investment thesis is predicated on predicted or future movements in the underlying instruments, rather than realization of a valuation discrepancy between securities.
MSCI Emerging Markets Index
The MSCI Emerging Markets Index captures large- and mid-cap representation across 24 emerging markets (EM) countries. With 1,328 constituents, the index covers approximately 85% of the free float–adjusted market capitalization in each country. EM countries include: Brazil, Chile, China, Colombia, Czech Republic, Egypt, Greece, Hungary, India, Indonesia, Korea, Kuwait, Malaysia, Mexico, Peru, the Philippines, Poland, Qatar, Saudi Arabia, South Africa, Taiwan, Thailand, Turkey, and the United Arab Emirates.
MSCI Europe ex UK Index
The MSCI Europe ex UK Index captures large- and mid-cap representation across 14 developed markets countries in Europe. With 338 constituents, the index covers approximately 85% of the free float–adjusted market capitalization across European developed markets excluding the United Kingdom.
MSCI Japan Index
The MSCI Japan Index is designed to measure the performance of the large- and mid-cap segments of the Japanese market. With 203 constituents, the index covers approximately 85% of the free float–adjusted market capitalization in Japan.
MSCI UK Index
The MSCI United Kingdom Index is designed to measure the performance of the large- and mid-cap segments of the UK market. With 79 constituents, the index covers approximately 85% of the free float–adjusted market capitalization in the United Kingdom.
MSCI US Index
The MSCI US Index is designed to measure the performance of the large- and mid-cap segments of the US market. With 625 constituents, the index covers approximately 85% of the free float–adjusted market capitalization in the United States.
MSCI World Index
The MSCI World Index represents a free float–adjusted, market capitalization–weighted index that is designed to measure the equity market performance of developed markets. It includes 23 developed markets (DM) country indexes. DM countries include: Australia, Austria, Belgium, Canada, Denmark, Finland, France, Germany, Hong Kong, Ireland, Israel, Italy, Japan, the Netherlands, New Zealand, Norway, Portugal, Singapore, Spain, Sweden, Switzerland, the United Kingdom, and the United States.
MSCI World ex US Index
The MSCI World ex US Index captures large- and mid-cap representation across 22 of 23 developed markets countries, excluding the United States. With 828 constituents, the index covers approximately 85% of the free float–adjusted market capitalization in each country.
S&P 500 ex Magnificent 7 Index
The S&P 500 ex Magnificent 7 Index tracks the SPDR® S&P 500® ETF Trust. The SPDR® S&P 500® ETF Trust seeks to provide investment results that, before expenses, correspond generally to the price and yield performance of the S&P 500® Index.
S&P SmallCap 600® Index
The S&P SmallCap 600® Index seeks to measure the small-cap segment of the US equity market. The index is designed to track companies that meet specific inclusion criteria to ensure that they are liquid and financially viable.
Société Générale Trend Index
The Société Générale Trend Index is equal-weighted and reconstituted annually. The index calculates the net daily rate of return for a pool of trend following based hedge fund managers.
US Benchmark 10-Year Datastream Government Index
Datastream has been calculating domestic government bond indices since 1985, based on the formulation recommended by EFFAS (European Federation of Financial Analysts Societies). Benchmark indices are based on single bonds. The bond chosen for each series is the most representative bond available for the given maturity band at each point in time. Benchmarks are selected according to the accepted conventions within each market. Generally, the benchmark bond is the latest issue within the given maturity band; consideration is also given to yield, liquidity, issue size, and coupon.
US Dollar Spot Price Index
The US Dollar Spot Price Index is an index (or measure) of the value of the US dollar relative to a basket of foreign currencies, often referred to as a basket of US trade partners’ currencies.
About Cambridge Associates
Cambridge Associates is a global investment firm with 50+ years of institutional investing experience. The firm aims to help pension plans, endowments & foundations, healthcare systems, and private clients implement and manage custom investment portfolios that generate outperformance and maximize their impact on the world. Cambridge Associates delivers a range of services, including outsourced CIO, non-discretionary portfolio management, staff extension and alternative asset class mandates. Contact us today.