VantagePoint: Avoiding Five Key Investment Pitfalls
The start of the year is an ideal time to review investment practices and procedures to ensure you are set up for success. Investing is challenging, even for the most seasoned investors, given the underlying emotions and mental biases inherent in human decision making. Successful investors have explicit investment processes that are clearly outlined and consistently implemented. Strong governance processes enable key stakeholders to reach a common understanding of objectives and responsibilities. In this edition of VantagePoint, we outline the following five key investment pitfalls that can steer investors off course and offer guidance on how to avoid them:
- Taking too little risk
- Firing excellent managers after a bout of underperformance
- Sizing individual positions too large
- Misunderstanding liquidity risk
- Failing to exercise strong governance
Pitfall #1: Taking Too Little Risk
Behavioral economists have found that individuals often value loss avoidance twice as much as wealth gains—a condition referred to as loss aversion. This bias can lead investors to take too little risk. To counter loss aversion, investors must understand the cost of taking too little risk and study the historical performance of markets during stress. Portfolio risk management policies should account for these biases, incorporating clear rebalancing requirements to maintain risk objectives and prevent return drag.
Investors typically exercise significant care in setting investment policy, thoroughly reviewing the role of asset pools in an institution, corporation, or family. A key outcome of this analysis is understanding the level and nature of risks to target—given return objectives, investment flexibility, volatility tolerance, liquidity needs, and other constraints. Despite careful planning, loss aversion can lead investors to treat risk targets as caps, dragging down returns.
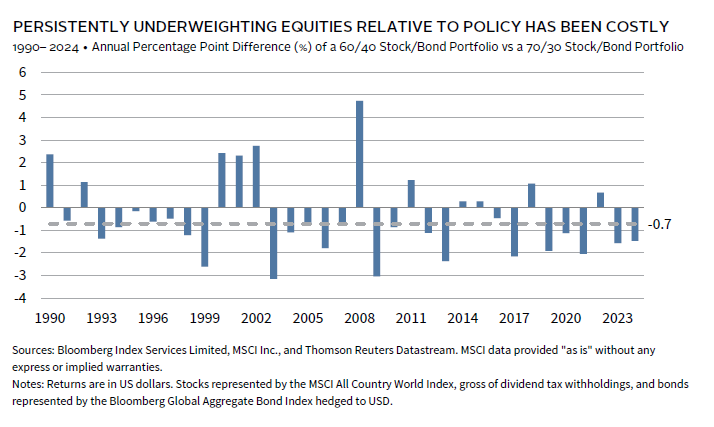
For example, investors often equate total portfolio standard deviation targets to a volatility-equivalent stock/bond portfolio. An investor with a 70% equity/30% bond volatility reference may implement a portfolio closer to a 60% equity/40% bond target. Since 1990, a 60/40 portfolio has outperformed a 70/30 portfolio in only 31% of years, with a median underperformance of 0.7 percentage points (ppts). Similarly, based on our long-term capital markets assumptions, the probability of a 60/40 portfolio outperforming over three- and five-year horizons is just 24% and 18%, respectively.
Portfolio risk levels fluctuate with market movements and capital markets conditions. A thoughtful investment strategy includes procedures to measure risks relative to policy and in absolute terms, with rebalancing policies to ensure portfolios maintain appropriate risk levels over time—not too much or too little. These policies are crucial during equity market downturns when loss aversion intensifies, and investor time horizons shorten. Historical data show that markets tend to mean revert from extremes, with equities and other risk assets performing strongly after downturns. However, rebalancing toward policy can be challenging, as it requires selling well-performing assets to buy those that have underperformed.
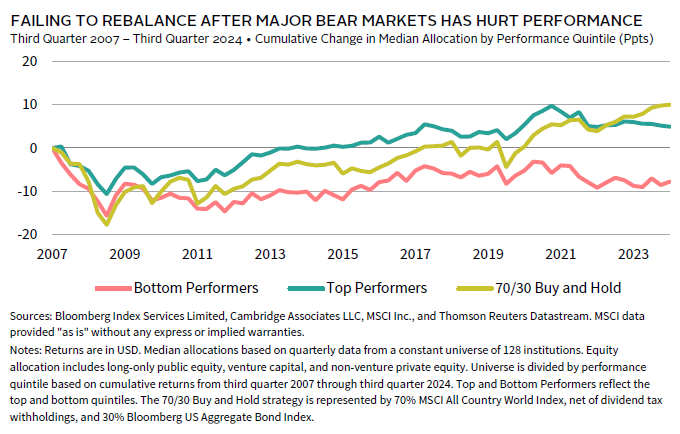
For example, many investors were slow to rebuild equity allocations following the Global Financial Crisis (GFC), and those that lagged the most experienced the worst returns. Analysis of institutions reporting asset allocation and performance data since third quarter 2007 shows that the median bottom-quintile performers kept public and private equity allocations below pre-GFC allocation for the entire subsequent 17-year period, while top performers took roughly seven years to regain prior equity levels. A buy-and-hold approach to a 70% equity/30% bond portfolio would have taken a decade to return to 2007 equity allocations; top performers re-risked portfolios more quickly. 1
Investors should be guided by long-term investment policy that includes an asset allocation framework designed to weather market cycles while maximizing the likelihood of meeting long-term return objectives. An investment policy that maintains adequate risk exposures throughout different market cycles includes asset allocation targets and meaningful ranges and provides clear guidance on rebalancing.
Pitfall #2: Firing Excellent Managers After a Bout of Underperformance
Investors often find it challenging to retain excellent managers during periods of underperformance. The temptation to dismiss managers after two or three years of underperformance relative to their market benchmark is understandable, driven by recency bias—focusing on recent data while discounting historical data. To overcome this bias, investors should acknowledge its prevalence and understand the historical success rates of managers.
Recent manager performance, even over the intermediate term, is a poor guide for hiring and firing decisions. A study by research firm Dalbar found that over the 30 years ended in 2023, the average US equity investor detracted more than 2 ppts annually due to behavioral issues, such as firing managers near their lows and hiring after strong performance.
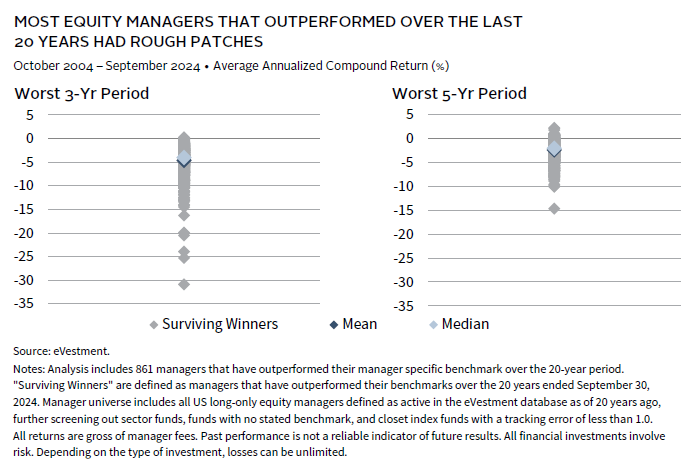
To resist the urge to fire excellent managers after poor performance, investors should understand what successful track records entail. It is also important to recognize how difficult it is to select successful active managers. Of the 3,214 US equity managers in the eVestment database at the start of the 20-year period ended September 30, 2024, a striking 64% are no longer reporting returns. However, 75% of the managers that continued reporting outperformed their benchmarks. Investors often tell us they can tolerate one or two years of underperformance, but not three. Yet, 99.7% of US equity managers that outperformed their benchmarks over the last 20 years underperformed for at least one three-year period, and 94.2% did so for at least one five-year period. The underperformance was often severe, with 36% of outperformers lagging by more than 5 ppts annually over three years and 10% lagging over five years.
Recognizing that even managers with strong long-term records experience underperformance, it is vital to maintain patience, assuming thorough due diligence has been conducted. This diligence should encourage investors to stay the course and resist the urge to fire managers after poor performance. Organizational factors such as governance, alignment of interests, firm culture, and a loyal investor base are critical for success.
Pitfall #3: Sizing Individual Positions Too Large
Investors engaging in active management hire multiple managers to achieve asset class/investment strategy returns and diversify manager-specific risks. Building diversified, actively managed portfolios is complicated by behavioral biases like overconfidence and heuristics in sizing decisions. Understanding these biases and developing appropriate portfolio construction and risk management practices are essential for success.
A thorough due diligence process helps investors stick with good managers over performance cycles. Sizing is another critical tool. Investors may choose to size managers differently based on expectations for excess returns; level and predictability of tracking error (i.e., volatility of excess returns relative to the strategy benchmark); degree of operating risk; and diversification properties. Liquidity terms may also influence sizing.
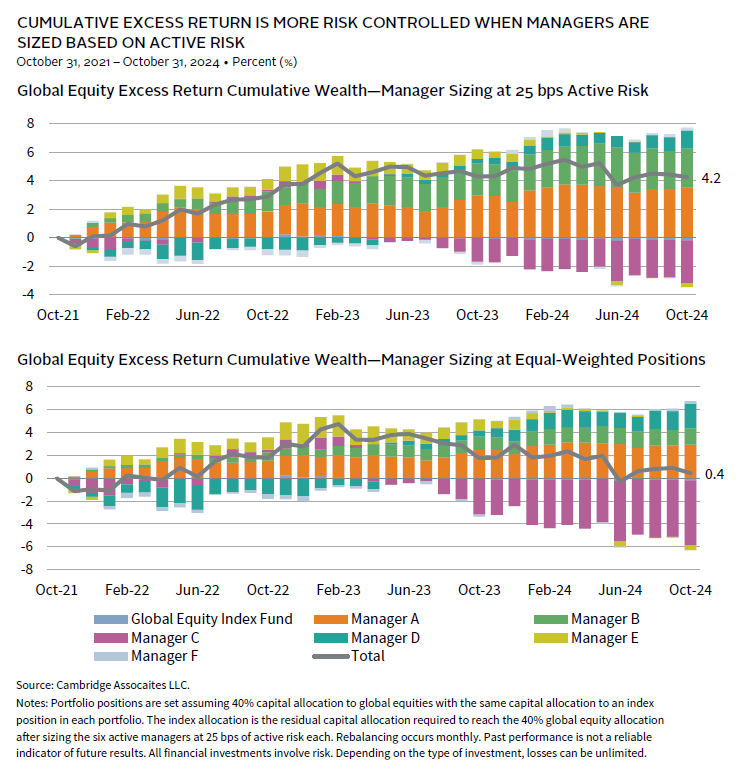
However, investors often determine sizing based on capital allocations, while the default view should be to normalize positions by tracking error. Active risk, or the manager’s tracking error multiplied by its capital allocation, is a better expression of sizing, as it reflects the potential impact on portfolio excess returns more holistically. For example, the figure below compares cumulative global equity portfolio value-added of a portfolio equal weighting active managers by active risk and by capital allocations. The portfolio that equal-weighted managers by active risk achieved 420 basis points (bps) of cumulative outperformance over three years. In contrast, the portfolio equal weighted by capital allocation left only 40 bps value-added. One manager was able to wipe out most of the value-added achieved by four of the six active managers.
Investors can become overconfident in a managers’ ability to add value, especially after strong outperformance, even though performance alone is a poor guide to successful manager selection. As such, we urge caution in sizing based on conviction about return expectations. Investors adopting these practices should regularly evaluate the degree to which sizing differentials are beneficial and adjust practices accordingly.
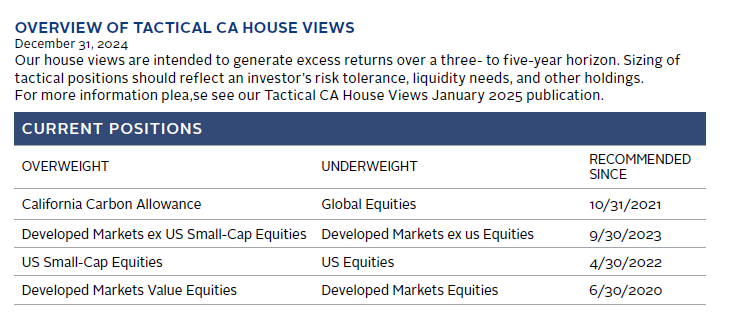
These sizing considerations apply not only to manager positions, but also to other portfolio bets, such as tactical position sizing or manager structure bets arising from sector, geographic, and other exposures compared to policy benchmarks. 2 Paying careful attention to position sizing and incorporating tracking error are essential in maintaining diversification across portfolio active positions.
Pitfall #4: Misunderstanding Liquidity Risk
Managing portfolio liquidity needs requires a dynamic and comprehensive approach. Evaluating portfolio liquidity by only considering typical asset class liquidity or liquidity conditions during calm periods can lead to poor estimates. A detailed assessment of liquidity sources is essential in developing investment policy, including maintaining adequate liquidity during stressed environments. Accurately understanding the capacity for illiquidity can enhance long-term performance, especially given the potential for higher value-added returns in illiquid strategies.
During market downturns, portfolio liquidity diminishes. Funds with gating provisions may lower gates, private investments may slow distributions relative to capital calls, and bid-ask spreads of less liquid markets may widen, requiring larger discounts to transact. Downturns can have systemic impacts, affecting bond issuers’ credit ratings and increasing borrowing costs. Institutions relying on charitable giving or cyclical revenues may see contributions drop during downturns, just when spending needs rise. Potential changes in tax circumstances should also be considered. Spending needs from long-term assets can increase—especially if other revenue/income sources decline—and are likely to remain constant in absolute terms, representing a higher share of asset values.
Investors with significant allocations to illiquid funds should stress test their portfolios and develop a plan for sourcing and using available liquidity during downturns. The key objectives are to understand how long portfolio liquidity will last (given cash flow needs, current asset allocation, and performance) and how the liquidity composition of the portfolio may change over time. This analysis should be paired with an assessment of the cost of increasing portfolio liquidity. It is possible to have too much liquidity, and an important objective of liquidity management should be to minimize cash holdings by closely monitoring liquidity sources and uses for contingency planning.
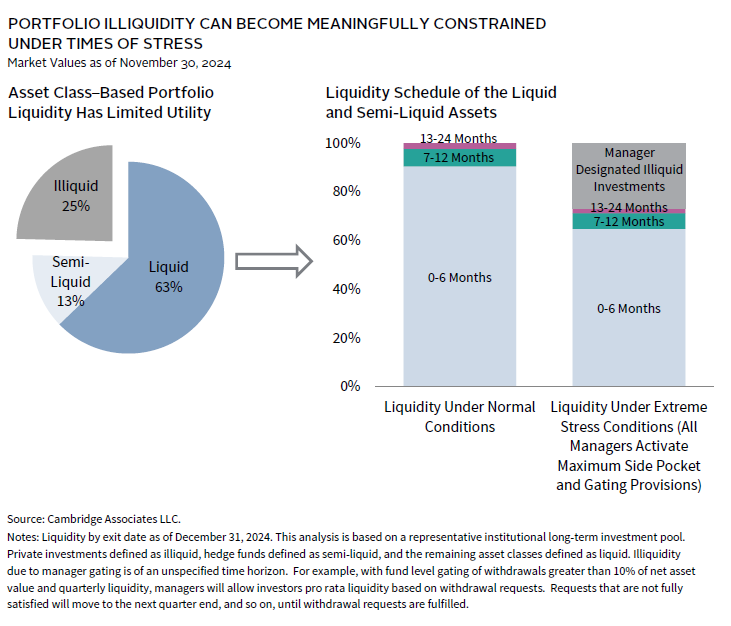
Using heuristics like asset allocation to understand portfolio liquidity can mischaracterize liquidity conditions in portfolios, especially for those with sizable allocations to hedge funds. For example, an institution (shown below) with roughly 25% in private investments may have considerable liquidity, even with 13% of the portfolio invested in hedge funds. However, recognizing nuances of manager redemption provisions and tracking initial lock-up periods are central to understanding true illiquidity conditions. In this example, 90% of liquid and semi-liquid assets, or 70% of the total portfolio, are available within six months. In extreme stress, if all manager fund gates are activated, zero- to six-month liquidity drops to about 65%, or 50% at the total portfolio level. 3 This remains a considerable degree of liquidity, manageable for most investors, but will not always be the case and cannot be known without attention to detail.
To fully understand if liquidity is adequate, consider also how asset declines would impact available liquidity, as market values may drop considerably (e.g., 30%+ for public equities) in stress. In the above example, the 50% total portfolio liquidity could easily fall another 10 ppts or more depending on the severity of the market decline. Additionally, consider the nature of illiquid investments and their expected capital call and distribution pace. Portfolios with more exposure to private credit might see increased capital calls in stress, while equity-related strategies may see activity slow until bid/ask gaps narrow and transactions resume. Further considerations include access to liquidity outside the portfolio from reserves, debt capacity, charitable donations, revenue, or earnings.
Understanding liquidity risk is crucial to set investment policy. By thoroughly assessing liquidity sources and uses and stress-testing portfolios, investors can better prepare for periods of financial stress. Grasping the nuances of liquidity dynamics and implementing robust liquidity management practices enables investors to enhance their resilience and capitalize on opportunities, even in challenging market conditions.
Pitfall #5: Failing to Exercise Strong Governance
Without strong governance, even the best-constructed investment plans can fall short of the mark. Effective governance—both at the enterprise level (e.g., institution, family office, and corporation) and specifically for the long-term investment pool—enhances the likelihood of sound decision making. It ensures decisions are timely, coordinated, and resilient against behavioral risks, especially during market stress.
Investors are not always rational actors; they are human, with emotional and psychological reactions to shocks. These include increased risk aversion, a desire for liquidity, shortened investment horizons, and reluctance to be contrarian. Recognizing these tendencies, what can be done? Developing and maintaining a sound investment policy and process is as much about effective risk management as it is about setting an appropriate investment strategy and asset allocation. Governance can mitigate mistakes from behavioral risks by simplifying decision making, instilling self-awareness and discipline, educating on expectations and market history, and designing well-crafted portfolios that focus on risk/reward trade-offs.
Best practice governance helps to instill discipline by setting guidelines and expectations in advance, preparing decision makers to act without surprise or overreaction. This applies to both decision makers and external stakeholders. Even the most capable decision makers may struggle to take proper action amid stakeholder opposition. Managing these risks is best achieved through continuous education on market history as it pertains to the policy portfolio, which should be reviewed regularly—ideally every one to three years.
Key points to reiterate include: the intended roles of investments; long-term return and volatility expectations; and the expected frequency, severity, and duration of declines. Re-affirming these should help stakeholders remember the policy’s purpose, lending it greater weight and staying power.
Celia Dallas, Chief Investment Strategist
Kate Colgan, David Kautter, Mike Kellett, Grayson Kirk, Jared Thomas, James Vivenzio, and Yuchen Yang also contributed to this publication.
The Bloomberg Global Aggregate Bond Index (USD Hedged) represents a close estimation of the performance that can be achieved by hedging the currency exposure of its parent index, the Bloomberg Global Aggregate Bond Index, to USD. The index is 100% hedged to USD by selling the forwards of all the currencies in the parent index at the one-month forward rate. The parent index is composed of government, government-related, and corporate bonds, as well as asset-backed, mortgage-backed and commercial mortgage-backed securities from both developed and emerging markets issuers.
The Bloomberg US Aggregate Bond Index is a broad-based flagship benchmark that measures the investment grade, US dollar-denominated, fixed-rate taxable bond market. The index includes Treasuries, government-related and corporate securities, fixed rate agency MBS, ABS, and CMBS (agency and non-agency). Provided the necessary inclusion rules are met, US Aggregate-eligible securities also contribute to the multi-currency Global Aggregate Index and the US Universal Index.
The MSCI ACWI captures large- and mid-cap representation across 23 developed markets and 24 emerging markets countries. With 2,947 constituents, the index covers approximately 85% of the global investable equity opportunity set.
Footnotes
- Top-quintile performers also had higher median allocations to private equity and venture capital, limiting their ability to reduce equity allocations and muting market drawdowns during the GFC, as valuations are not marked down as much or as quickly as publicly listed equities.
- For example, a portfolio using a mix of global and regional managers to implement their policy allocation to global equities may find they have underweights or overweights to individual countries or regions. These positions should be evaluated, as unintentional bets are unlikely to be compensated.
- Side pocket illiquidity in this portfolio, assuming maximum permissible side pockets, increases illiquidity by just 1%.
About Cambridge Associates
Cambridge Associates is a global investment firm with 50+ years of institutional investing experience. The firm aims to help pension plans, endowments & foundations, healthcare systems, and private clients implement and manage custom investment portfolios that generate outperformance and maximize their impact on the world. Cambridge Associates delivers a range of services, including outsourced CIO, non-discretionary portfolio management, staff extension and alternative asset class mandates. Contact us today.

