US PE/VC Benchmark Commentary: Calendar Year 2023
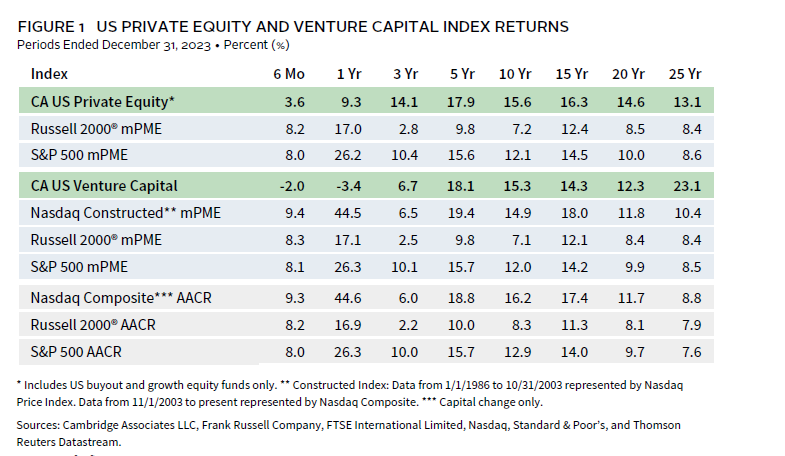
In 2023, US private equity (PE) performed better than venture capital (VC), but returns for both asset classes trailed those of the public markets, which rebounded strongly from a tough 2022. For calendar year 2023, the Cambridge Associates LLC US Private Equity Index® returned 9.3% and the Cambridge Associates LLC US Venture Capital Index® returned -3.4%. Information technology (IT) continued to be the largest sector in PE and VC and produced divergent results across buyouts and growth equity (the components of the PE benchmark) and venture capital. Tech buyouts, which are generally mature companies, performed the best and growth equity–backed technology companies earned better returns than those in the VC index. Figure 1 depicts performance for the private asset classes compared to the public markets. 1
Calendar Year 2023 Highlights
- Despite posting lower short-term results (six months and one year) than the public markets as of December 31, 2023, the US PE index outperformed relevant public indexes in every period longer than three years. The US VC benchmark’s performance relative to public indexes has been more mixed, in part due to its lackluster returns since 2021.
- After spiking during the COVID-19 pandemic era, exposures to public companies in the PE/VC indexes have fallen. At the end of 2023, public companies accounted for a modestly higher percentage of the market value of the VC index’s market value than of the PE one (roughly 8% and 7%, respectively). At the same time, non-US companies represented about 20% of PE and 13% of VC.
Hear Andrea Auerbach, Global Head of Private Investments, discuss where she sees opportunity in private equity. View the full interview.
US Private Equity Performance Insights
In 2023, a macro environment marked by stubbornly high interest rates, geopolitical tensions, and a concentrated but strong rebound in the public market proved to be challenging for PE fundraising, investment activity, and exits. PE portfolio company valuations, which tend to move directionally with the those of public companies, neither fell dramatically in 2022 nor rose massively in 2023 and in both years, were more resilient in buyouts than in growth equity. Limited partner (LP) cash flows were down again in 2023 as market uncertainty and a large bid-ask spread constrained buying and selling, leading to fewer capital calls and distributions. As of the end of 2023, four vintages (2018–21) accounted for nearly 60% of the PE index’s value, which is not surprising, given the abundant fundraising in that era. All four vintages earned at least 9.6% for the year.
According to Dealogic, in 2023, seven US PE-backed companies went public, and they were valued at $19 billion; the number of initial public offerings (IPOs) was up from 2022 (two), but the overall value was down about $3 billion. Among the seven, two were IT-related businesses, two were consumer companies, and there was one each in energy, financials, and healthcare. The number of PE-backed merger & acquisition (M&A) transactions trailed the total completed in 2022 (1,060 versus 1,150), marking the second consecutive drop in M&A exits. Only 17% (or 180 deals) had publicly disclosed valuations and based on the data available, the average transaction size among those deals was $1.2 billion, about $90 million less than the average in 2022. During 2023, there was not much variation in the number of deals by quarter, but the total and average deal values were by far the lowest in the fourth quarter.
Vintage Years
As of December 2023, eight vintage years (2015–22) were meaningfully sized—representing at least 5% of the benchmark’s value—and, combined, accounted for 86% of the index’s value. Calendar-year returns among the key vintages ranged from 1.8% for 2015 to 13.5% for 2022; the 2015 and 2022 vintages represented 6% of the index’s value at year’s end, placing them at the small end of the largest vintages. The two largest vintages, 2019 and 2021, returned 9.6% and 11.7%, respectively (Figure 2).
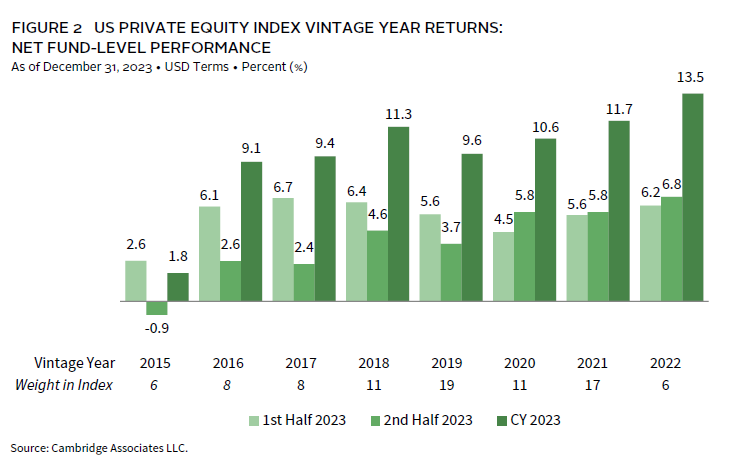
Part of the divergence of returns across the vintage years was related to the performance of the fund strategies within the PE universe—buyouts and growth equity—which do not share the same return profiles. In 2023, for instance, the benchmark for US buyout funds earned 10.4%, while the US growth equity index posted a 6.1% return. Similarly, for all large vintages except for 2015 and 2016, buyouts meaningfully outperformed growth equity. Additionally, the younger vintages (2018–22) generally earned higher returns than more mature ones (2015–17).
Write-ups in industrials and to a lesser extent IT boosted returns for the top-performing vintage (2022), while in the lowest-returning vintage (2015), write-ups in consumer discretionary and IT were somewhat offset by write-downs in financials and other sectors. Values across the key sectors were written up in the largest vintages, 2019 and 2021, with financials and healthcare earning the highest returns in the 2019 cohort, and financials, healthcare, and IT leading the way for the 2021 funds.
LP Cash Flows
In 2023, limited partner (LP) cash flows were on par with activity last seen in 2020, with $137 billion in capital calls and $125 billion in distributions. Both totals represented declines from 2022, a 27% drop in calls and a 12% drop in distributions. Following ten years (2012–21) of distributions equaling or surpassing contributions, over the past two years, calls outpaced distributions by a ratio of 1.2x. However, during the second half of 2023, fund managers returned more capital to LPs than they called, perhaps a hopeful sign for distributions but also an indication of a less active investment environment.
Five vintage years (2019–23) represented 89% ($123 billion) of the capital calls, with each drawing down at least $10 billion during the year; the 2021 and 2022 vintages were the most active, combining to call almost $85 billion. Seven vintages (2013–19) accounted for most of the distributions, and within that group, the 2016–17 and 2019 vintages led the way as each returned about $17 billion to LPs.
Sectors
Figure 3 shows the Global Industry Classification Standard (GICS®) sector breakdown by market value of the PE index and a public market counterpart, the Russell 2000® Index. The comparison provides context when comparing the performance of the two indexes. The PE index continued to have a significant overweight to IT and meaningful underweights to financials, energy, and real estate (the latter two are reflected in the “other” category).
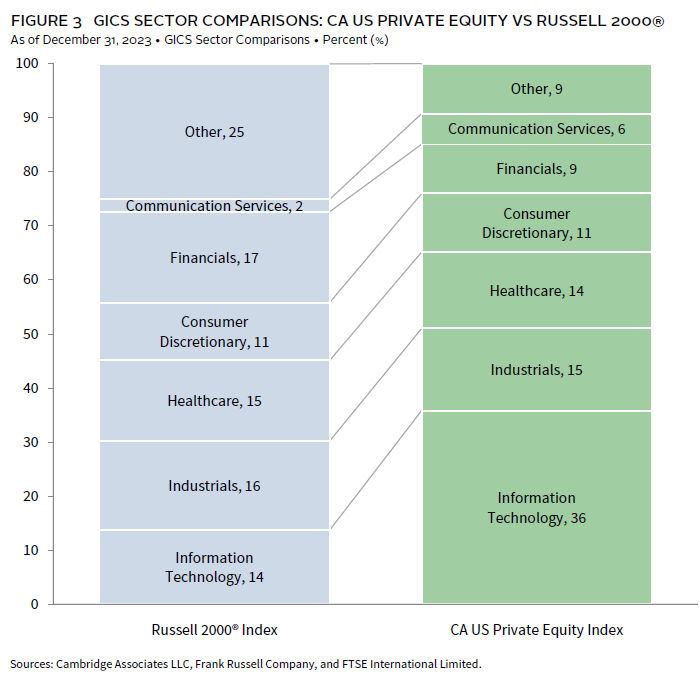
As of December 2023, there were six key sectors by size and IT was by far the largest (36% of the index’s market value). Three of the six large sectors earned double-digit returns for the year (IT, financials, and industrials) and among all six, calendar year returns were best for IT and lowest for communication services.
US Venture Capital Performance Insights
For the second consecutive year, the CA US venture capital index produced a negative return in 2023 (-3.4%), as the industry continued its reset with respect to valuations, fundraising, investing, and exits. Performance for IT companies was a significant drag on the benchmark’s return, a stark difference from the public market indexes, whose rebounds in 2023 were buoyed by a small number of tech-related companies.
According to the National Venture Capital Association and Pitchbook, by number, US VC managers completed about 18% fewer deals in 2023 than they did in 2022 (14,491 from 17,709), a smaller decline than when measured by value ($166 billion from $242 billion in 2022). Exits have declined more dramatically, especially by number. Compared to 2022, total reported exits (1,073) fell 24% in 2023, driven by a slower environment for M&A and buyouts, rather than in IPOs, which were marginally higher in 2023 than in 2022. Values for M&A exits declined commensurately with the drop by number and despite the small increase by number, the value of IPO exits was also lower in 2023 than in 2022. Notably, for the second consecutive year, the value of exits via M&A was higher than those of public listings in 2023, while the number of M&A exits (755) was the lowest of any of the last ten years.
Vintage Years
As of December 2023, nine vintage years (2014–22) were meaningfully sized and combined, accounted for 81% of the index’s value. With one exception (13.9% for vintage year 2022), returns across the key vintages were largely negative, ranging from -9.6% (2014) to -0.8% (2021) (Figure 4). With a 0.5% return in the fourth quarter, the VC index ended its seven-quarter streak of negative returns, its longest since the tech wreck that started at the end of 2000.
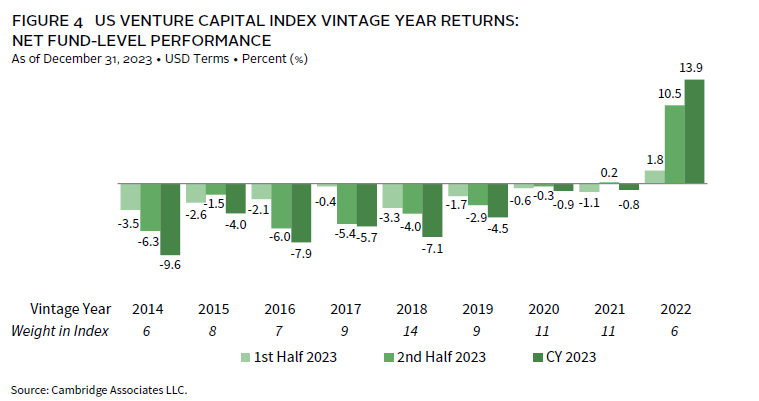
For the lone key vintage (2022) that earned a positive return during the year, all sectors except for IT performed well. In the lowest-performing vintage, 2014, all key sectors suffered write-downs. For the 2021 cohort, financials was the biggest drag on returns.
LP Cash Flows
Amid the challenging investment and exit environment, US VC LP cash flows declined in 2023, with capital calls ($30.3 billion) mirroring those of 2020 and distributions ($19.4 billion) hitting the lowest total since 2016. After ten straight calendar years (2012–21) of distributions outpacing calls, the reverse was true the past two years, with calls outnumbering distributions by a ratio of 1.3x.
Four vintages (2020–23) accounted for 89% (roughly $27 billion) of the total capital called during the year. While each vintage called more than $3.4 billion, the 2021 and 2022 groups were the most active, combining for almost $19 billion in total. Distributions were more widespread than contributions, with seven vintages (2012–18) returning at least $1.2 billion to LPs for a combined $13 billion. The 2012 vintage distributed more than $3 billion, the most of any group.
Sectors
Figure 5 shows the GICS® sector breakdown of the VC index by market value and a public market counterpart, the Nasdaq Composite Index. The breakdown provides context when comparing the performance of the two indexes. The chart highlights the VC index’s meaningfully higher exposures to healthcare, financials, and industrials. The indexes are both heavily tilted toward IT, and Nasdaq weightings in communication services and consumer discretionary have remained much higher than those of the VC index.
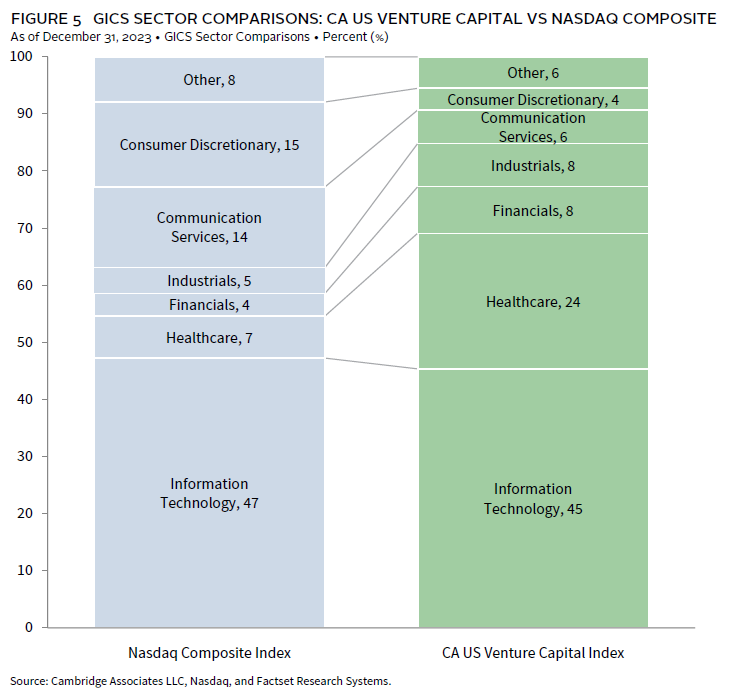
Collectively, the five meaningfully sized sectors made up 91% of the VC index. Communication services posted the lowest return and industrials the best.
View more investment insights.
Caryn Slotsky, Managing Director
Wyatt Yasinski, Associate Investment Director
Drew Carneal, Associate Investment Director
US Private Equity and Venture Capital Index Returns
Private indexes are pooled horizon internal rates of return, net of fees, expenses, and carried interest. Returns are annualized, with the exception of returns less than one year, which are cumulative. Because the US private equity and venture capital indexes are capitalization weighted, the largest vintage years mainly drive the indexes’ performance.
Vintage Year Returns
Vintage year fund-level returns are net of fees, expenses, and carried interest.
Sector Returns
Industry-specific gross company-level returns are before fees, expenses, and carried interest.
GICS® Sector Comparisons
The Global Industry Classification Standard (GICS®) was developed by and is the exclusive property and a service mark of MSCI Inc. and S&P Global Market Intelligence LLC and is licensed for use by Cambridge Associates LLC.
About the Cambridge Associates LLC Indexes
Cambridge Associates derives its US private equity benchmark from the financial information contained in its proprietary database of private equity funds. As of December 31, 2023, the database included 1,572 US buyout and growth equity funds formed from 1986 to 2023, with a value of $1.5 trillion. Ten years ago, as of December 31, 2013, the index included 900 funds whose value was $521 billion.
Cambridge Associates derives its US venture capital benchmark from the financial information contained in its proprietary database of venture capital funds. As of December 31, 2023, the database comprised 2,483 US venture capital funds formed from 1981 to 2023, with a value of $470 billion. Ten years ago, as of December 31, 2013, the index included 1,468 funds whose value was $154 billion.
The pooled returns represent the net end-to-end rates of return calculated on the aggregate of all cash flows and market values as reported to Cambridge Associates by the funds’ general partners in their quarterly and annual audited financial reports. These returns are net of management fees, expenses, and performance fees that take the form of a carried interest.
About the Public Indexes
The Nasdaq Composite Index is a broad-based index that measures all securities (more than 3,000) listed on the Nasdaq Stock Market. The Nasdaq Composite is calculated under a market capitalization–weighted methodology.
The Standard & Poor’s 500 Composite Stock Price Index is a capitalization-weighted index of 500 stocks intended to be a representative sample of leading companies in leading industries within the US economy. Stocks in the index are chosen for market size, liquidity, and industry group representation.
Footnotes
- Cambridge Associates’ mPME calculation is a private-to-public comparison that seeks to replicate private investment performance under public market conditions.
About Cambridge Associates
Cambridge Associates is a global investment firm with 50+ years of institutional investing experience. The firm aims to help pension plans, endowments & foundations, healthcare systems, and private clients implement and manage custom investment portfolios that generate outperformance and maximize their impact on the world. Cambridge Associates delivers a range of services, including outsourced CIO, non-discretionary portfolio management, staff extension and alternative asset class mandates. Contact us today.